

Intel Core i5-14500 vs Intel Core i9-14900 vs Intel Core i7-14700
Intel Core i5-14500
► remove from comparisonThe Intel Core i5-14500 is a fast and relative efficient desktop processor based on the Raptor Lake architecture, which was introduced in 2022. The processor offers a base clock of 2.6 GHz and reaches up to 5.0 GHz in Turbo. The hybrid CPU architecture introduced with Alder Lake is also used in the Raptor Lake processors. Compared to the Intel Core i5-13500, however, the Intel Core i5-14500 only offers a slight advantage. The number of cores is identical and Intel has only minimally increased the clock rates of the P and E cores in the Core i5-14500.
Performance
Due to the same number of physical computing units, the Intel Core i5-14500 only offers a minimal difference in performance compared to the Intel Core i5-13500, which is only due to the increased clock rates. Compared to the even older Intel Core i5-12500, which has to make do completely without E-cores, the performance difference is significantly higher.
Graphics unit
Like the Intel Core i5-13500, the Intel Core i5-14500 offers an integrated graphics unit. The already widespread Intel Iris Xe architecture continues to serve as the basis. In terms of performance, nothing has changed with the new Intel UHD Graphics 770.
Power consumption
The TDP of the Intel Core i5-14500 is 65 watts, with the option to increase this to up to 154 watts in Turbo mode. Compared to the Intel Core i5-13500, Intel has not made any changes to the TDP limits.
Intel Core i9-14900
► remove from comparison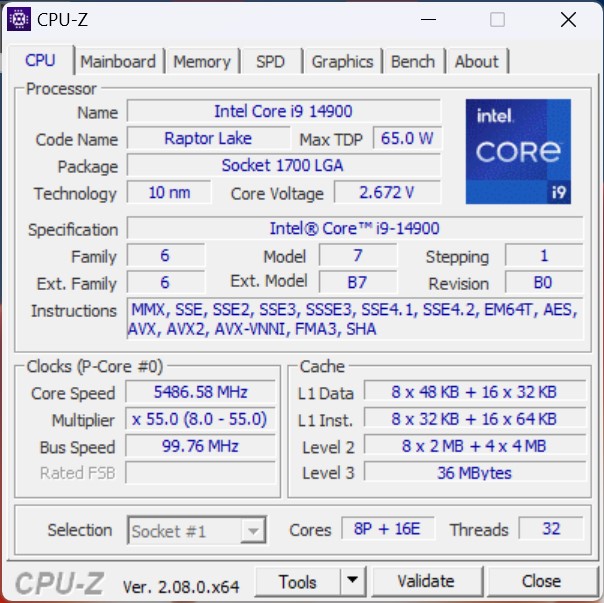
The Intel Core i9-14900 is a high-end processor based on the Raptor Lake architecture. The base clock is 2 GHz and can reach up to 5.8 GHz under optimal conditions. Similar to the top model (Intel Core i9-14900K), the total of 32 threads are divided into 8 p- and 16 e-cores. The 8 performance cores (p-cores) also offer hyperthreading, which means that a total of 32 threads can be processed simultaneously. The non-K model is an economical processor. There is still the option of DDR4 or DDR5 memory.
Performance
Compared to the Intel Core i9-14900K, the Core i9-14900 offers the same number of physical computing units. However, due to the lower power consumption, the Intel Core i9-14900 delivers slightly less performance. The intended use is primarily for compact PCs with limited cooling options.
Graphics unit
Like the Intel Core i9-14900K, the Intel Core i9-14900 offers an integrated graphics unit. The Intel Iris Xe architecture continues to serve as the basis. In terms of performance, however, nothing has changed with the Intel UHD Graphics 770.
Power consumption
The Intel Core i9-14900 is specified with a TDP of 65 watts, which corresponds to the PL1 value. In boost mode, the processor's performance can increase to up to 219 watts (PL2). However, this requires very good cooling. Compared to the Intel Core i9-13900, the specified power consumption has not changed.
Intel Core i7-14700
► remove from comparison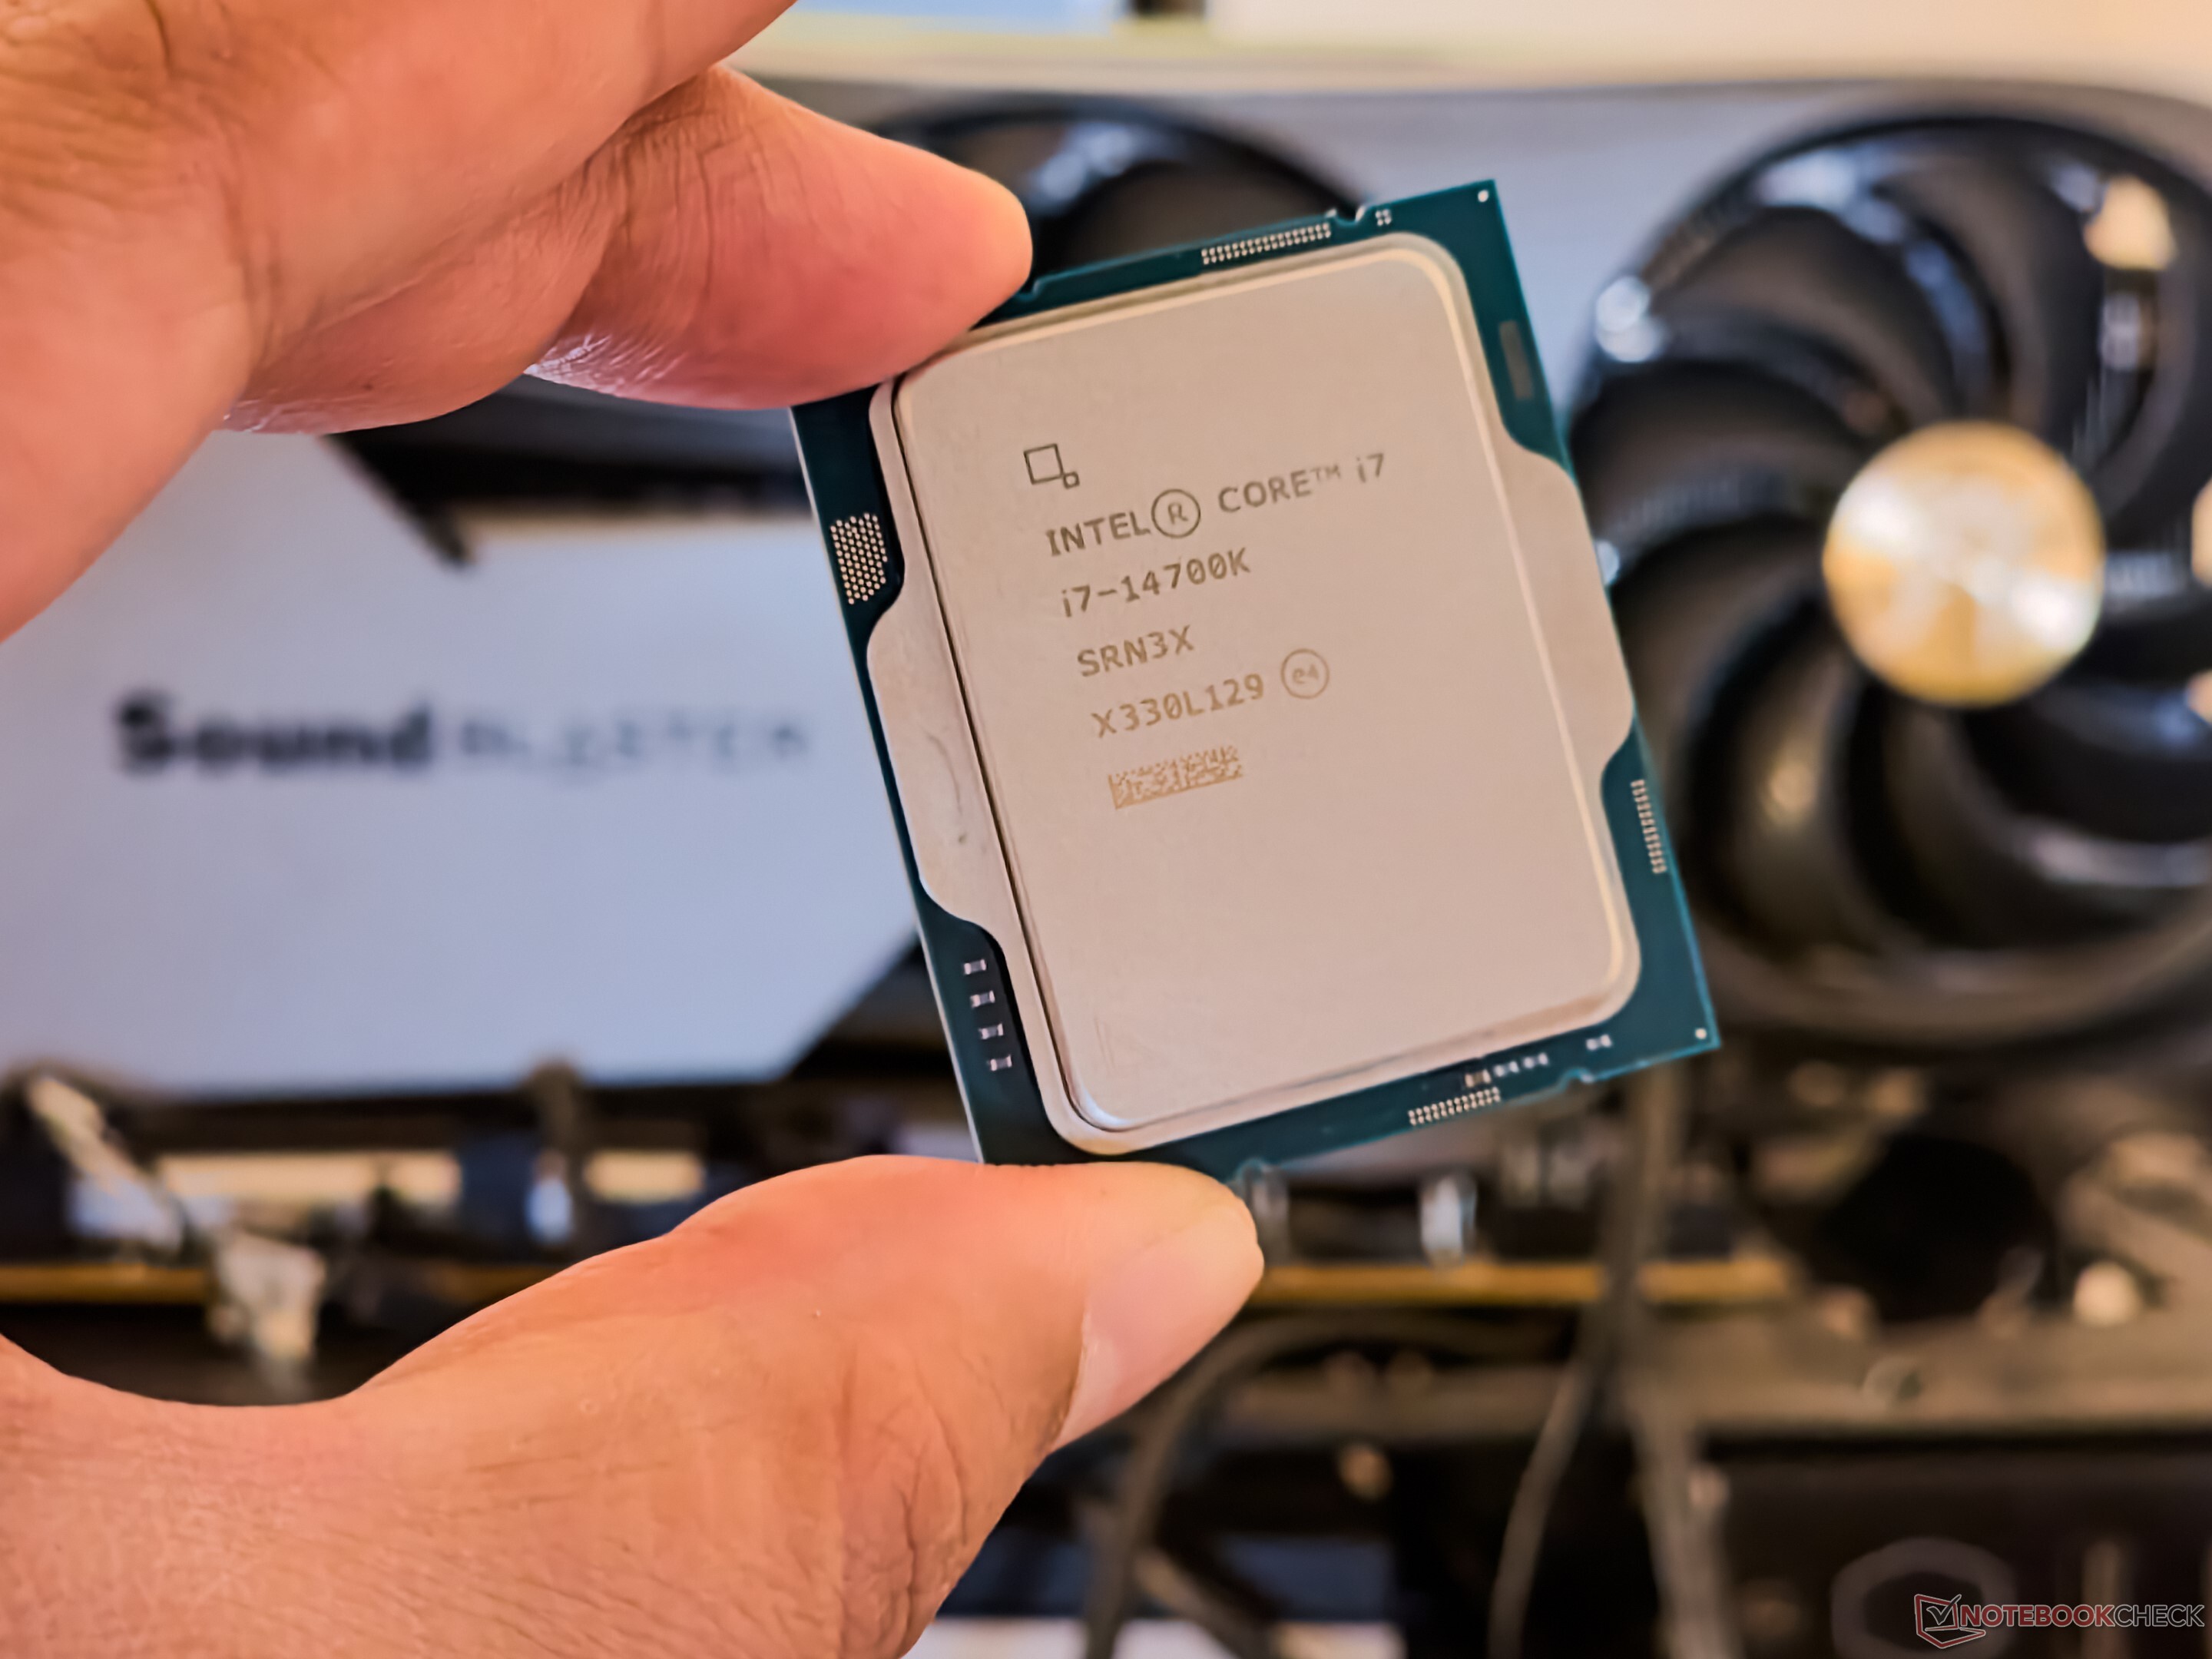
The Intel Core i7-14700 is a desktop processor based on the Raptor Lake architecture, which inherits the 13th generation of Intel Core processors with minor improvements. The processor offers a base clock of 1.5 GHz or 2.1 GHz and reaches up to 5.4 GHz in Turbo. The basic CPU structure remains unchanged. The Intel Core i7-14700 features 8 P-cores and 12 E-cores, allowing up to 28 threads to be processed in parallel. It is also based on the LGA 1700 socket, which was already introduced with Alder Lake.
Graphics unit
Like the Intel Core i7-13700K, the Intel Core i7-14700 also has an integrated graphics unit. The Intel Iris Xe architecture continues to serve as the basis. In terms of performance, however, nothing has changed with the Intel UHD Graphics 770.
Power consumption
The TDP of the Intel Core i7-14700 is 65 watts, with the option of consuming up to 219 watts in Turbo mode.
| Model | Intel Core i5-14500 | Intel Core i9-14900 | Intel Core i7-14700 | ||||||||||||||||||||||||||||||||||||||||||||||||||||||||||||||||||||||||||||||||||||
| Codename | Raptor Lake | Raptor Lake | Raptor Lake | ||||||||||||||||||||||||||||||||||||||||||||||||||||||||||||||||||||||||||||||||||||
| Series | Intel Raptor Lake-R | Intel Raptor Lake-R | Intel Raptor Lake-R | ||||||||||||||||||||||||||||||||||||||||||||||||||||||||||||||||||||||||||||||||||||
| Series: Raptor Lake-R Raptor Lake |
|
|
| ||||||||||||||||||||||||||||||||||||||||||||||||||||||||||||||||||||||||||||||||||||
| Clock | 2600 - 5000 MHz | 2000 - 5800 MHz | 1500 - 5400 MHz | ||||||||||||||||||||||||||||||||||||||||||||||||||||||||||||||||||||||||||||||||||||
| L2 Cache | 11.5 MB | 32 MB | 28 MB | ||||||||||||||||||||||||||||||||||||||||||||||||||||||||||||||||||||||||||||||||||||
| L3 Cache | 24 MB | 36 MB | 33 MB | ||||||||||||||||||||||||||||||||||||||||||||||||||||||||||||||||||||||||||||||||||||
| Cores / Threads | 14 / 20 6 x 5.0 GHz Intel Raptor Cove P-Core 8 x 3.7 GHz Intel Gracemont E-Core | 24 / 32 8 x 5.8 GHz Intel Raptor Cove P-Core 16 x 4.3 GHz Intel Gracemont E-Core | 20 / 28 8 x 5.4 GHz Intel Raptor Cove P-Core 12 x 4.2 GHz Intel Gracemont E-Core | ||||||||||||||||||||||||||||||||||||||||||||||||||||||||||||||||||||||||||||||||||||
| TDP | 65 Watt | 65 Watt | 65 Watt | ||||||||||||||||||||||||||||||||||||||||||||||||||||||||||||||||||||||||||||||||||||
| TDP Turbo PL2 | 154 Watt | 219 Watt | 219 Watt | ||||||||||||||||||||||||||||||||||||||||||||||||||||||||||||||||||||||||||||||||||||
| Technology | 10 nm | 10 nm | 10 nm | ||||||||||||||||||||||||||||||||||||||||||||||||||||||||||||||||||||||||||||||||||||
| Die Size | 215 mm2 | 257 mm2 | |||||||||||||||||||||||||||||||||||||||||||||||||||||||||||||||||||||||||||||||||||||
| max. Temp. | 100 °C | 100 °C | 100 °C | ||||||||||||||||||||||||||||||||||||||||||||||||||||||||||||||||||||||||||||||||||||
| Socket | LGA 1700 | LGA 1700 | LGA 1700 | ||||||||||||||||||||||||||||||||||||||||||||||||||||||||||||||||||||||||||||||||||||
| Features | Intel UHD Graphics 770, DDR5 4800 MT/s, DDR4 3200 MT/s | Intel UHD Graphics 770, max. 192 GB of DDR5 5600 MT/s or DDR4 3200 MT/s | |||||||||||||||||||||||||||||||||||||||||||||||||||||||||||||||||||||||||||||||||||||
| iGPU | Intel UHD Graphics 770 (300 - 1550 MHz) | Intel UHD Graphics 770 (300 - 1650 MHz) | Intel UHD Graphics 770 (300 - 1600 MHz) | ||||||||||||||||||||||||||||||||||||||||||||||||||||||||||||||||||||||||||||||||||||
| Architecture | x86 | x86 | x86 | ||||||||||||||||||||||||||||||||||||||||||||||||||||||||||||||||||||||||||||||||||||
| Announced | |||||||||||||||||||||||||||||||||||||||||||||||||||||||||||||||||||||||||||||||||||||||
| Manufacturer | www.intel.de | www.intel.de | www.intel.com | ||||||||||||||||||||||||||||||||||||||||||||||||||||||||||||||||||||||||||||||||||||
| $549 U.S. | $384 U.S. |

Benchmarks
Average Benchmarks Intel Core i5-14500 → 100% n=25
Average Benchmarks Intel Core i9-14900 → 148% n=25
Average Benchmarks Intel Core i7-14700 → 139% n=25
* Smaller numbers mean a higher performance
1 This benchmark is not used for the average calculation