Notebookcheck Logo

NVIDIA T1000 vs NVIDIA Quadro RTX 6000 (Laptop) vs NVIDIA Quadro T1000 (Laptop)

NVIDIA T1000

► remove from comparison

The Nvidia T1000 is a professional desktop graphics card for small entry-level workstations. It is based on the same TU117 Turing chip as the consumer GeForce GTX1650. The number of shader units is also identical at 896. With 8 GB VRAM, the Nvidia T1000 however offers more VRAM, which is still connected via a 128 bit memory bus. The power consumption of the Nvidia T1000 is only rated at 50 watts and therefore does not require an additional power connection.

The professional graphics cards offer certified drivers which are optimized for stability and performance in professional applications (CAD, DCC, medical, prospecting, visualization applications). As a result, the performance in these areas is significantly better compared to consumer graphics cards with the same chip.

In contrast to the more powerful RTX cards (e.g. Quadro RTX 3000), they do not offer ray tracing and tensor cores. The Turing architecture has also seen significant improvements at the CUDA core level. Float and INT operations can now be executed simultaneously, the cache has been standardized and improved and adaptive shading has been introduced. As a result, Nvidia claims up to 50% higher performance per core compared to Pascal.

NVIDIA Quadro RTX 6000 (Laptop)

► remove from comparison NVIDIA Quadro RTX 6000 (Laptop)

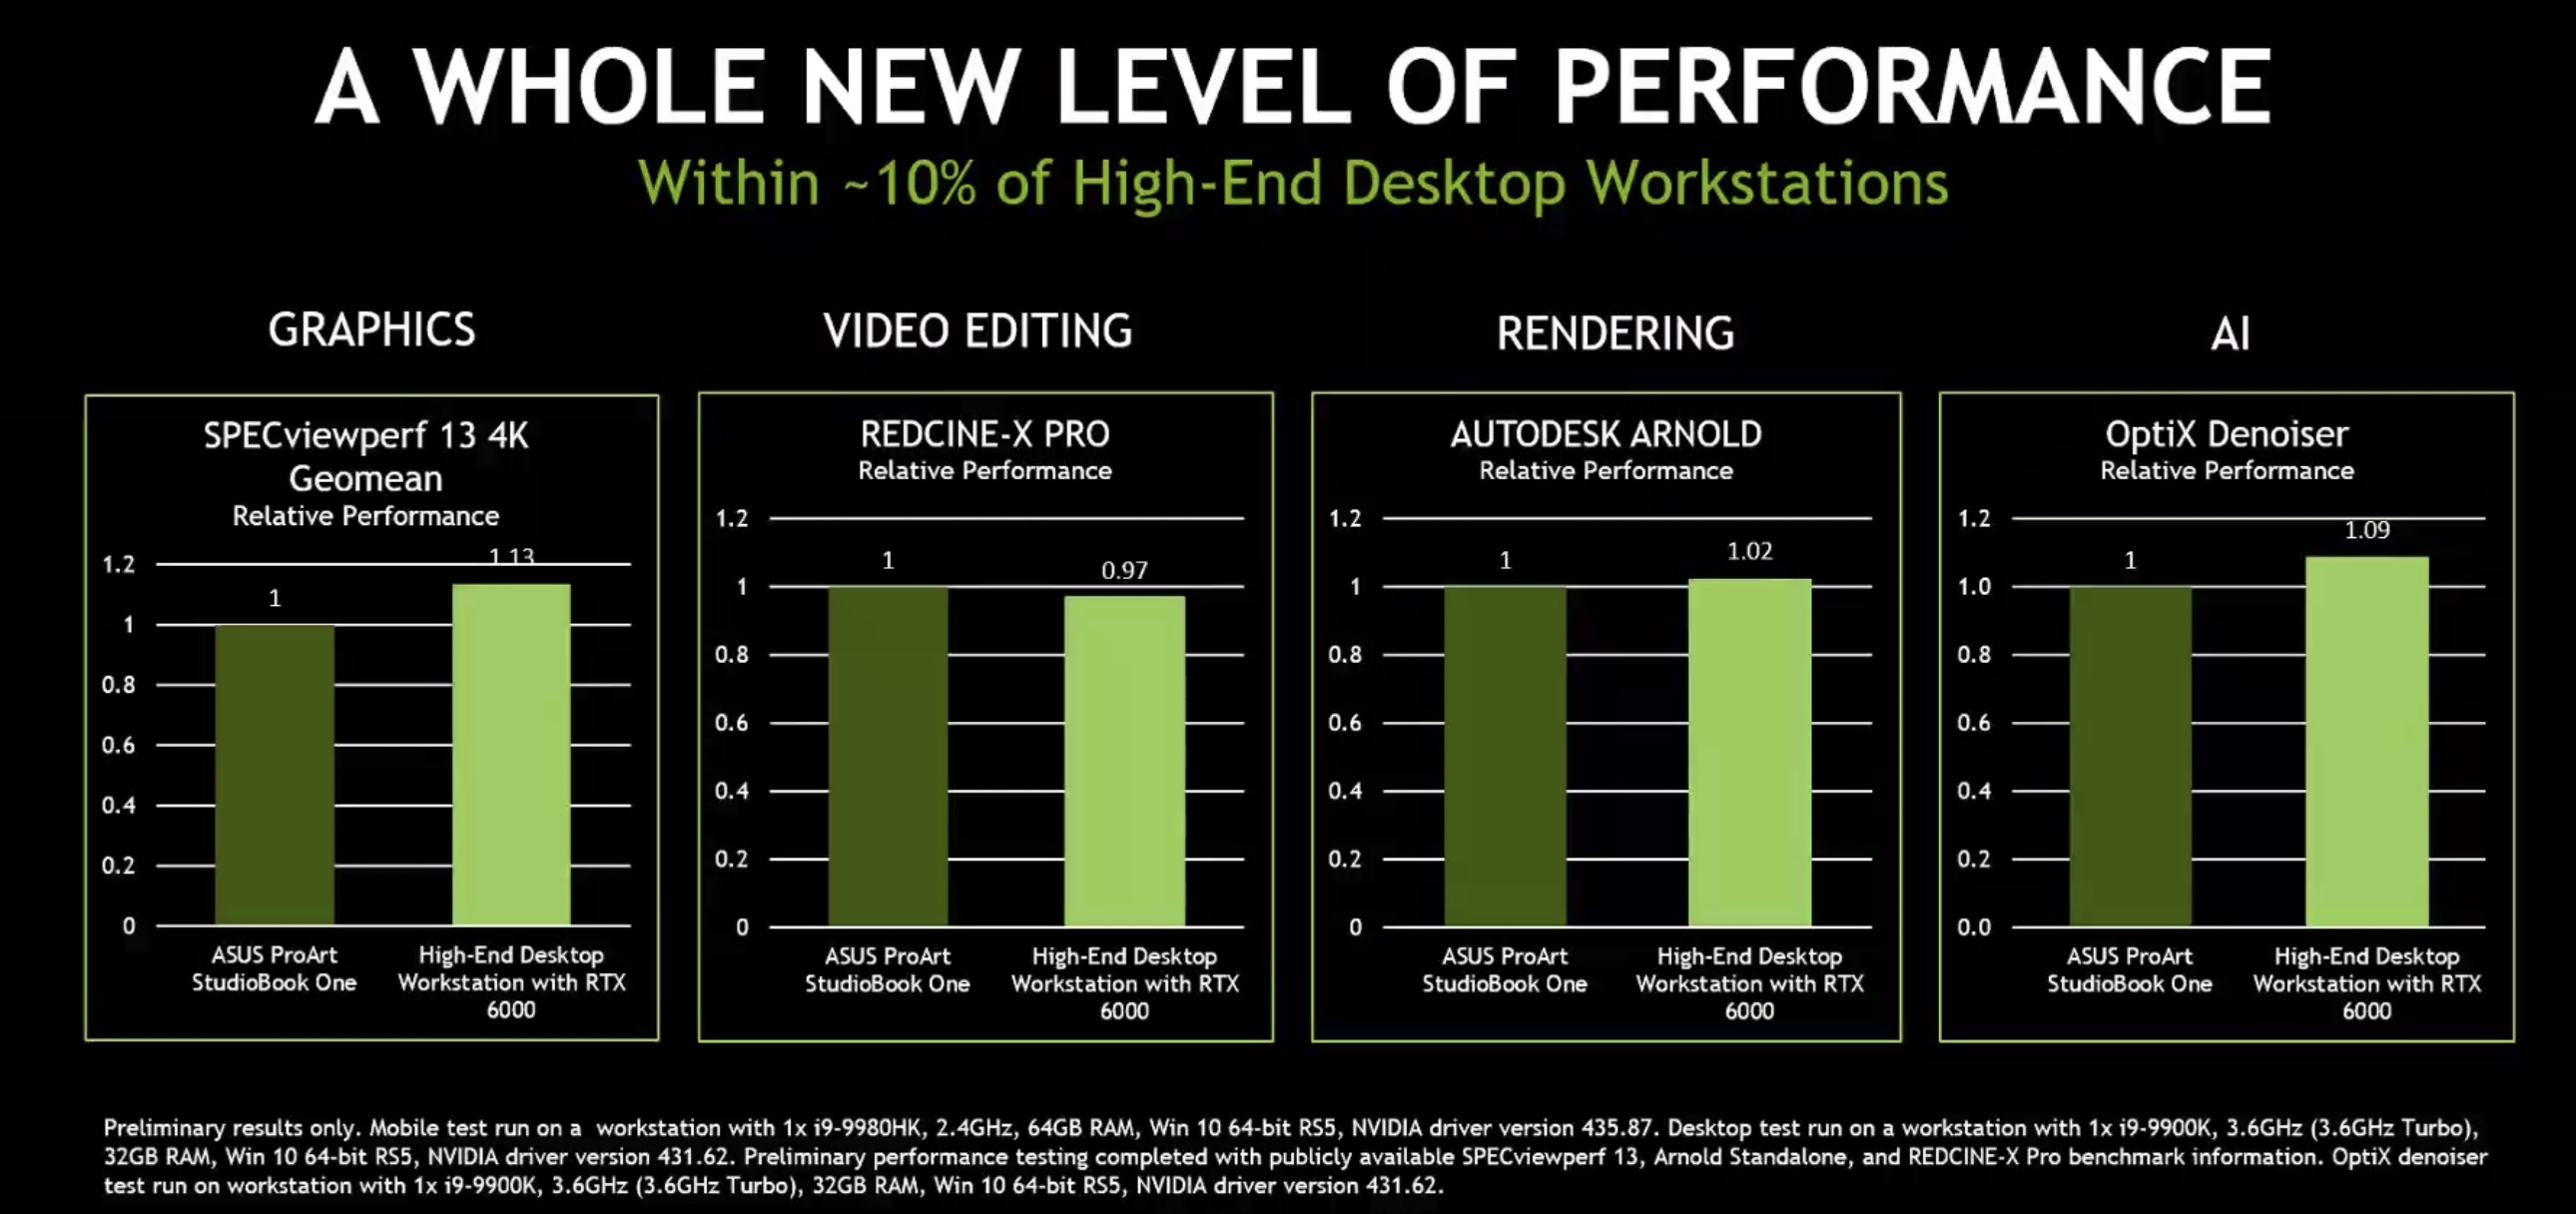
The Nvidia Quadro RTX 6000 for laptops is a professional high-end graphics card for big and powerful laptops and mobile workstations. It is based on the same TU102 chip as the consumer GeForce RTX 2080 Ti. Compared to the desktop RTX 6000, the mobile variant offers lower clock speeds.

The Quadro GPUs offer certified drivers, which are optimized for stability and performance in professional applications (CAD, DCC, medical, prospection, and visualizing applications). The performance in these areas is therefore much better compared to corresponding consumer GPUs.

Features

NVIDIA manufacturers the TU102 chip on a 12 nm FinFET process and includes features like Deep Learning Super Sampling (DLSS) and Real-Time Ray Tracing (RTRT), which should combine to create more realistic lighting effects than older GPUs based on the company's Pascal architecture (if the games support it). The Quadro RTX 6000 is also DisplayPort 1.4 ready, while there is also support for HDMI 2.0b, HDR, Simultaneous Multi-Projection (SMP) and H.265 video en/decoding (PlayReady 3.0).

Performance

Due to the lower clock speeds, the mobile RTX 6000 lags slightly behind the desktop version with the same name. Nvidia states for example that a desktop system using the RTX 6000 is on average 13% faster in the SPECviewperf13 4k benchmark.

Due to the extremely high power consumption of 200 Watt (TDP), the mobile Quadro RTX 6000 needs an excellent cooling solution and will be used only in big laptops.

NVIDIA Quadro T1000 (Laptop)

► remove from comparison NVIDIA Quadro T1000 (Laptop)

The Nvidia Quadro T1000 for laptops is a professional mobile graphics card that is based on the Turing architecture (TU117 chip). Compared to the consumer GTX 1650, the Quadro T1000 features less CUDA cores / shaders (768 versus 896). The Quadro T2000 uses the same TU117 chip, but features all 1024 cores (2x to the T1000) and is therefore significantly faster. The chip is manufactured in 12nm FinFET at TSMC. 

The Turing generation did not only introduce raytracing for the RTX cards, but also optimized the architecture of the cores and caches. According to Nvidia the CUDA cores offer now a concurrent execution of floating point and integer operations for increased performance in compute-heavy workloads of modern games. Furthermore, the caches were reworked (new unified memory architecture with twice the cache compared to Pascal). This leads to up to 50% more instructions per clock and a 40% more power efficient usage compared to Pascal. In contrary to the faster Quadro RTX cards, the T1000 and T2000 don not feature raytracing and Tensor cores.

NVIDIA T1000NVIDIA Quadro RTX 6000 (Laptop)NVIDIA Quadro T1000 (Laptop)
Quadro Turing Series
Quadro RTX 6000 (Laptop) 4608 @ 1.28 - 1.46 GHz384 Bit @ 14000 MHz
Quadro RTX 5000 (Laptop) 3072 @ 1.04 - 1.55 GHz256 Bit @ 14000 MHz
Quadro RTX 5000 Max-Q 3072 @ 0.6 - 1.35 GHz256 Bit @ 14000 MHz
Quadro RTX 4000 (Laptop) 2560 @ 1.11 - 1.56 GHz256 Bit @ 14000 MHz
Quadro RTX 4000 Max-Q 2560 @ 0.78 - 1.38 GHz256 Bit @ 14000 MHz
Quadro RTX 3000 (Laptop) 1920 @ 0.95 - 1.38 GHz192 Bit @ 14000 MHz
Quadro RTX 3000 Max-Q 1920 @ 0.6 - 1.22 GHz192 Bit @ 14000 MHz
Quadro T2000 (Laptop) 1024 @ 1.58 - 1.79 GHz128 Bit @ 8000 MHz
Quadro T2000 Max-Q 1024 @ 0.93 - 1.5 GHz128 Bit @ 8000 MHz
Quadro T1000 (Laptop) 768 @ 1.4 - 1.46 GHz128 Bit @ 8000 MHz
T1000 896 @ 1.07 - 1.4 GHz128 Bit @ 10000 MHz
T1200 Laptop GPU 1024 @ 0.86 - 1.43 GHz128 Bit @ 10000 MHz
Quadro T1000 Max-Q 768 @ 0.8 - 1.46 GHz128 Bit @ 8000 MHz
T600 Laptop GPU 896 @ 1.4 GHz128 Bit @ 10000 MHz
T550 Laptop GPU 1024 @ 1.07 - 1.67 GHz64 Bit @ 12000 MHz
T500 Laptop GPU 896 @ 1.37 - 1.7 GHz64 Bit @ 10000 MHz
T600 640 @ 0.74 - 1.34 GHz128 Bit @ 10000 MHz
ArchitectureTuringTuringTuring
Pipelines896 - unified4608 - unified768 - unified
TMUs56
ROPs32
Core Speed1065 - 1395 (Boost) MHz1275 - 1455 (Boost) MHz1395 - 1455 (Boost) MHz
Theoretical Performance5000 TFLOPS FP16, 2500 TFLOPS FP32, 0.7812 TFLOPS FP64
Memory Speed10000 effective = 1250 MHz14000 MHz8000 MHz
Memory Bus Width128 Bit384 Bit128 Bit
Memory TypeGDDR6GDDR6GDDR5
Max. Amount of Memory8 GB24 GB4 GB
Shared Memorynonono
Memory Bandwidth160 GB/s
APIDirectX 12_1, Shader 6.8, OpenGL 4.6, OpenCL 3.0, Vulkan 1.3DirectX 12_1, OpenGL 4.6DirectX 12_1, OpenGL 4.6
Power Consumption50 Watt200 Watt50 Watt
Transistors4.7 Billion18.6 Billion
Die Size 200 mm²
technology12 nm12 nm12 nm
PCIe3.0 x16
Displays4 Displays (max.), DisplayPort 1.4a
Date of Announcement06.05.2021 04.09.2019 27.05.2019
CodenameTU102N19P-Q1
FeaturesNVLink, DLSS, Raytraycing, VR Ready, G-SYNC, Vulkan, Multi Monitor
Notebook Sizelargemedium sized

Benchmarks

Performance Rating - 3DMark 11 + Fire Strike + Time Spy - T1000
3.2 pt (9%)
Restrict / Search: Model: Max. age: years
Performance Rating - 3DMark 11 + Fire Strike + Time Spy - Quadro T1000 (Laptop)
3.3 pt (10%)
Restrict / Search: Model: Max. age: years
3DMark - 3DMark Time Spy Score
3534 Points (9%)
11084 Points (29%)
min: 3006     avg: 3348     median: 3474 (9%)     max: 3565 Points
3DMark - 3DMark Time Spy Graphics
100%
1 T1000 +
3088 Points (6%)
min: 2834     avg: 3123     median: 3261 (7%)     max: 3273 Points
3DMark - 3DMark Ice Storm Unlimited Graphics
100%
1 T1000 +
398761 Points (40%)
375510 Points (38%)
3DMark - 3DMark Ice Storm Extreme Graphics
100%
1 T1000 +
179865 Points (21%)
122046 Points (14%)
3DMark - 3DMark Cloud Gate Score
100%
1 T1000 +
37881 Points (36%)
min: 23601     avg: 25273     median: 25273 (24%)     max: 26945 Points
3DMark - 3DMark Cloud Gate Graphics
100%
1 T1000 +
50553 Points (12%)
min: 48965     avg: 53629     median: 53628.5 (13%)     max: 58292 Points
3DMark - 3DMark Fire Strike Standard Score
100%
1 T1000 +
8124 Points (12%)
min: 6812     avg: 7589     median: 7783 (12%)     max: 8173 Points
3DMark - 3DMark Fire Strike Standard Graphics
100%
1 T1000 +
8450 Points (8%)
min: 7558     avg: 8347     median: 8727 (8%)     max: 8757 Points
3DMark - 3DMark Ice Storm Graphics
100%
1 T1000 +
237130 Points (26%)
min: 86096     avg: 111211     median: 111211 (12%)     max: 136326 Points
3DMark - 3DMark Night Raid
100%
1 T1000 +
34584 Points (33%)
3DMark - 3DMark Night Raid Graphics Score
100%
1 T1000 +
41157 Points (16%)
3DMark 11 - 3DM11 Performance Score
100%
1 T1000 +
12953 Points (16%)
min: 10211     avg: 11241     median: 11592 (14%)     max: 11919 Points
3DMark 11 - 3DM11 Performance GPU
100%
1 T1000 +
11793 Points (9%)
min: 10407     avg: 11305     median: 11377 (9%)     max: 12132 Points
3DMark Vantage
3DM Vant. Perf. total + NVIDIA T1000
3DMark Vantage - 3DM Vant. Perf. total
100%
1 T1000 +
46318 Points (13%)
3DM Vant. Perf. total + NVIDIA Quadro T1000 (Laptop)
31509 Points (9%)
3DM Vant. Perf. GPU no PhysX + NVIDIA T1000
3DMark Vantage - 3DM Vant. Perf. GPU no PhysX
100%
1 T1000 +
39668 Points (22%)
3DM Vant. Perf. GPU no PhysX + NVIDIA Quadro T1000 (Laptop)
33740 Points (18%)
3DMark 05 - 3DMark 05 - Standard
100%
1 T1000 +
78565 Points (86%)
3DMark 06 3DMark 06 - Standard 1280x1024 + NVIDIA T1000
3DMark 06
100%
1 T1000 +
58968 Points (77%)
3DMark 06 - Standard 1280x1024 + NVIDIA Quadro T1000 (Laptop)
min: 33809     avg: 35034     median: 35033.5 (46%)     max: 36258 Points
Unigine Valley 1.0 - Unigine Valley 1.0 DX
100%
1 T1000 +
42.2 fps (13%)
min: 36.7     avg: 39.3     median: 39.3 (12%)     max: 41.9 fps
Unigine Heaven 3.0 - Unigine Heaven 3.0 DX 11
110.3 fps (37%)
Unigine Heaven 3.0 - Unigine Heaven 3.0 OpenGL
101.1 fps (45%)
Unigine Heaven 2.1 - Heaven 2.1 high
min: 136.9     avg: 149.7     median: 149.7 (28%)     max: 162.4 fps
Blender - Blender 3.3 Classroom CUDA *
100%
1 T1000 +
159 Seconds (24%)
Blender - Blender 3.3 Classroom OPTIX *
100%
1 T1000 +
159 Seconds (59%)
SPECviewperf 12
specvp12 sw-03 + NVIDIA Quadro T1000 (Laptop)
SPECviewperf 12 - specvp12 sw-03
113.8 fps (28%)
specvp12 snx-02 + NVIDIA Quadro T1000 (Laptop)
SPECviewperf 12 - specvp12 snx-02
82.7 fps (12%)
specvp12 showcase-01 + NVIDIA Quadro T1000 (Laptop)
SPECviewperf 12 - specvp12 showcase-01
40.3 fps (7%)
specvp12 mediacal-01 + NVIDIA Quadro T1000 (Laptop)
SPECviewperf 12 - specvp12 mediacal-01
min: 24.99     avg: 29.9     median: 29.9 (8%)     max: 34.8 fps
specvp12 maya-04 + NVIDIA Quadro T1000 (Laptop)
SPECviewperf 12 - specvp12 maya-04
min: 47.5     avg: 56.3     median: 56.3 (15%)     max: 65.1 fps
specvp12 energy-01 + NVIDIA Quadro T1000 (Laptop)
SPECviewperf 12 - specvp12 energy-01
min: 5.79     avg: 6.8     median: 6.8 (6%)     max: 7.9 fps
specvp12 creo-01 + NVIDIA Quadro T1000 (Laptop)
SPECviewperf 12 - specvp12 creo-01
min: 75     avg: 79.5     median: 79.5 (32%)     max: 83.9 fps
specvp12 catia-04 + NVIDIA Quadro T1000 (Laptop)
SPECviewperf 12 - specvp12 catia-04
min: 82.4     avg: 87.7     median: 87.7 (14%)     max: 93 fps
specvp12 3dsmax-05 + NVIDIA Quadro T1000 (Laptop)
SPECviewperf 12 - specvp12 3dsmax-05
min: 85.5     avg: 93.8     median: 93.8 (14%)     max: 102.1 fps
SPECviewperf 13 specvp13 sw-04 + NVIDIA Quadro RTX 6000 (Laptop)
SPECviewperf 13 - specvp13 sw-04
217 fps (58%)
specvp13 sw-04 + NVIDIA Quadro T1000 (Laptop)
min: 89.2     avg: 99.7     median: 104.4 (28%)     max: 105.6 fps
specvp13 3dsmax-06 + NVIDIA Quadro RTX 6000 (Laptop)
SPECviewperf 13 - specvp13 3dsmax-06
217 fps (34%)
specvp13 3dsmax-06 + NVIDIA Quadro T1000 (Laptop)
min: 83.9     avg: 94.8     median: 98.5 (15%)     max: 101.9 fps
specvp13 snx-03 + NVIDIA Quadro T1000 (Laptop)
SPECviewperf 13 - specvp13 snx-03
min: 127.8     avg: 136.4     median: 133.1 (15%)     max: 148.4 fps
specvp13 showcase-02 + NVIDIA Quadro T1000 (Laptop)
SPECviewperf 13 - specvp13 showcase-02
min: 35.27     avg: 40.4     median: 40.2 (7%)     max: 45.71 fps
specvp13 medical-02 + NVIDIA Quadro T1000 (Laptop)
SPECviewperf 13 - specvp13 medical-02
min: 33.45     avg: 41.7     median: 41.6 (7%)     max: 50.1 fps
specvp13 maya-05 + NVIDIA Quadro T1000 (Laptop)
SPECviewperf 13 - specvp13 maya-05
min: 101     avg: 109.6     median: 113.3 (13%)     max: 114.6 fps
specvp13 energy-02 + NVIDIA Quadro T1000 (Laptop)
SPECviewperf 13 - specvp13 energy-02
min: 12     avg: 15.1     median: 15.6 (5%)     max: 17.8 fps
specvp13 creo-02 + NVIDIA Quadro T1000 (Laptop)
SPECviewperf 13 - specvp13 creo-02
min: 99.9     avg: 108.6     median: 109.5 (16%)     max: 116.3 fps
specvp13 catia-05 + NVIDIA Quadro T1000 (Laptop)
SPECviewperf 13 - specvp13 catia-05
min: 121.3     avg: 130     median: 130.5 (15%)     max: 138.3 fps
SPECviewperf 2020 specvp2020 medical-03 1080p + NVIDIA T1000
SPECviewperf 2020 - specvp2020 medical-03 1080p
100%
1 T1000 +
39.3 fps (11%)
specvp2020 medical-03 1080p + NVIDIA Quadro T1000 (Laptop)
19.2 fps (5%)
specvp2020 energy-03 1080p + NVIDIA T1000
SPECviewperf 2020 - specvp2020 energy-03 1080p
100%
1 T1000 +
18.1 fps (3%)
specvp2020 energy-03 1080p + NVIDIA Quadro T1000 (Laptop)
15.6 fps (3%)
specvp2020 creo-03 1080p + NVIDIA T1000
SPECviewperf 2020 - specvp2020 creo-03 1080p
100%
1 T1000 +
78.1 fps (27%)
specvp2020 creo-03 1080p + NVIDIA Quadro T1000 (Laptop)
67.5 fps (23%)
specvp2020 catia-06 1080p + NVIDIA T1000
SPECviewperf 2020 - specvp2020 catia-06 1080p
100%
1 T1000 +
37.3 fps (18%)
specvp2020 catia-06 1080p + NVIDIA Quadro T1000 (Laptop)
33.6 fps (16%)
specvp2020 3dsmax-07 1080p + NVIDIA T1000
SPECviewperf 2020 - specvp2020 3dsmax-07 1080p
100%
1 T1000 +
44 fps (12%)
specvp2020 3dsmax-07 1080p + NVIDIA Quadro T1000 (Laptop)
45.3 fps (12%)
specvp2020 medical-03 4k + NVIDIA T1000
SPECviewperf 2020 - specvp2020 medical-03 4k
100%
1 T1000 +
13.4 fps (9%)
specvp2020 maya-06 4k + NVIDIA T1000
SPECviewperf 2020 - specvp2020 maya-06 4k
100%
1 T1000 +
62.8 fps (9%)
specvp2020 energy-03 4k + NVIDIA T1000
SPECviewperf 2020 - specvp2020 energy-03 4k
100%
1 T1000 +
9.5 fps (1%)
specvp2020 creo-03 4k + NVIDIA T1000
SPECviewperf 2020 - specvp2020 creo-03 4k
100%
1 T1000 +
43.3 fps (19%)
specvp2020 catia-06 4k + NVIDIA T1000
SPECviewperf 2020 - specvp2020 catia-06 4k
100%
1 T1000 +
21.9 fps (14%)
specvp2020 3dsmax-07 4k + NVIDIA T1000
SPECviewperf 2020 - specvp2020 3dsmax-07 4k
100%
1 T1000 +
27.4 fps (9%)
specvp2020 solidworks-05 1080p + NVIDIA Quadro T1000 (Laptop)
SPECviewperf 2020 - specvp2020 solidworks-05 1080p
78.8 fps (15%)
specvp2020 snx-04 1080p + NVIDIA Quadro T1000 (Laptop)
SPECviewperf 2020 - specvp2020 snx-04 1080p
132.7 fps (16%)
specvp2020 maya-06 1080p + NVIDIA Quadro T1000 (Laptop)
SPECviewperf 2020 - specvp2020 maya-06 1080p
134.3 fps (14%)
Cinebench R10 Cinebench R10 Shading (32bit) + NVIDIA T1000
Cinebench R10 - Cinebench R10 Shading (32bit)
100%
1 T1000 +
6837 Points (5%)
Cinebench R10 Shading (32bit) + NVIDIA Quadro T1000 (Laptop)
6818 Points (5%)
Cinebench R11.5 Cinebench R11.5 OpenGL 64 Bit + NVIDIA T1000
Cinebench R11.5 - Cinebench R11.5 OpenGL 64 Bit
100%
1 T1000 +
252.5 fps (83%)
Cinebench R11.5 OpenGL 64 Bit + NVIDIA Quadro T1000 (Laptop)
124 fps (41%)
Cinebench R15
Cinebench R15 OpenGL 64 Bit + NVIDIA T1000
Cinebench R15 - Cinebench R15 OpenGL 64 Bit
100%
1 T1000 +
335.8 fps (20%)
Cinebench R15 OpenGL 64 Bit + NVIDIA Quadro T1000 (Laptop)
min: 166     avg: 182.6     median: 185.7 (11%)     max: 196 fps
Cinebench R15 OpenGL Ref. Match 64 Bit + NVIDIA T1000
Cinebench R15 - Cinebench R15 OpenGL Ref. Match 64 Bit
100%
1 T1000 +
99.6 % (100%)
Cinebench R15 OpenGL Ref. Match 64 Bit + NVIDIA Quadro T1000 (Laptop)
min: 99.6     avg: 99.7     median: 99.6 (100%)     max: 100 %
GFXBench - GFXBench 5.0 Aztec Ruins High Tier Offscreen
89.3 fps (16%)
GFXBench - GFXBench 5.0 Aztec Ruins Normal Tier Offscreen
225.8 fps (17%)
GFXBench - GFXBench Car Chase Offscreen
min: 145.6     avg: 154.9     median: 154.9 (15%)     max: 164.2 fps
GFXBench 3.1 - GFXBench Manhattan ES 3.1 Offscreen
min: 220.2     avg: 243.6     median: 243.6 (5%)     max: 267 fps
GFXBench 3.0 - GFXBench 3.0 Manhattan Offscreen
min: 269     avg: 315.3     median: 315.3 (13%)     max: 361.6 fps
GFXBench (DX / GLBenchmark) 2.7
GFXBench T-Rex HD Offscreen C24Z16 + NVIDIA Quadro T1000 (Laptop)
GFXBench (DX / GLBenchmark) 2.7 - GFXBench T-Rex HD Offscreen C24Z16
min: 575     avg: 660     median: 659.5 (5%)     max: 744 fps
Basemark GPU 1.2 - Basemark GPU 1.2 Vulkan Official Medium Offscreen 1080
100%
1 T1000 +
386 fps (9%)
Basemark GPU 1.2 - Basemark GPU 1.2 Vulkan Official High Offscreen 2160
100%
1 T1000 +
31.9 fps (6%)
Geekbench 6.4 - Geekbench 6.4 GPU OpenCL
100%
1 T1000 +
38611 Points (10%)
Geekbench 6.4 - Geekbench 6.4 GPU Vulkan
100%
1 T1000 +
36031 Points (9%)
LuxMark v2.0 64Bit - LuxMark v2.0 Room GPU
100%
1 T1000 +
1987 Samples/s (7%)
min: 1375     avg: 1410     median: 1409.5 (5%)     max: 1444 Samples/s
LuxMark v2.0 64Bit - LuxMark v2.0 Sala GPU
100%
1 T1000 +
4129 Samples/s (7%)
min: 2567     avg: 2768     median: 2768 (5%)     max: 2969 Samples/s
ComputeMark v2.1 - ComputeMark v2.1 Result
100%
1 T1000 +
6369 Points (5%)
min: 5376     avg: 5966     median: 5965.5 (5%)     max: 6555 Points
Power Consumption - Furmark Stress Test Power Consumption - external Monitor *
100%
1 T1000 +
101.9 Watt (14%)
88.8 Watt (12%)
Power Consumption - The Witcher 3 Power Consumption - external Monitor *
93.8 Watt (13%)
Power Consumption - Witcher 3 Power Consumption *
min: 83     avg: 89     median: 89 (20%)     max: 95 Watt
Power Consumption - Power Efficiency - Witcher 3 ultra
min: 0.3684     avg: 0.4     median: 0.4 (37%)     max: 0.4566 fps per Watt
Power Consumption - Power Efficiency - Witcher 3 ultra external Monitor
0.4 fps per Watt (33%)
Power Consumption - Cyberpunk 2077 Power Consumption - external Monitor *
100%
1 T1000 +
156.8 Watt (20%)
Power Consumption - Power Efficiency - Cyberpunk 2077 ultra
100%
1 T1000 +
0.1 fps per Watt (10%)
Emissions Witcher 3 Fan Noise + NVIDIA Quadro T1000 (Laptop)
Emissions - Witcher 3 Fan Noise
min: 36.9     avg: 37.3     median: 37.3 (60%)     max: 37.7 dB(A)
Clock Speed - GPU Clock Witcher 3 ultra
1237 MHz (49%)
Clock Speed - GPU Clock Speed Furmark
1543 MHz (61%)

Average Benchmarks NVIDIA T1000 → 100% n=1

Average Benchmarks NVIDIA Quadro RTX 6000 (Laptop) → 314% n=1

Average Benchmarks NVIDIA Quadro T1000 (Laptop) → 98% n=1

- Range of benchmark values for this graphics card
red legend - Average benchmark values for this graphics card
* Smaller numbers mean a higher performance
1 This benchmark is not used for the average calculation

Game Benchmarks

The following benchmarks stem from our benchmarks of review laptops. The performance depends on the used graphics memory, clock rate, processor, system settings, drivers, and operating systems. So the results don't have to be representative for all laptops with this GPU. For detailed information on the benchmark results, click on the fps number.

F1 24

F1 24

2024
low 1920x1080
100%
T1000:
98.4  fps
med. 1920x1080
100%
T1000:
82.6  fps
high 1920x1080
100%
T1000:
58.8  fps
low 1920x1080
100%
T1000:
22  fps
med. 1920x1080
100%
T1000:
19  fps
high 1920x1080
100%
T1000:
15  fps
ultra 1920x1080
100%
T1000:
10  fps
low 1920x1080
100%
T1000:
138.6  fps
med. 1920x1080
100%
T1000:
90.8  fps
high 1920x1080
100%
T1000:
50.6  fps
ultra 1920x1080
100%
T1000:
39.8  fps
low 1920x1080
100%
T1000:
44  fps
med. 1920x1080
100%
T1000:
40  fps
high 1920x1080
100%
T1000:
38  fps
low 1920x1080
100%
T1000:
45.1  fps
med. 1920x1080
100%
T1000:
34.2  fps
high 1920x1080
100%
T1000:
28.3  fps
ultra 1920x1080
100%
T1000:
23.8  fps
low 1920x1080
100%
T1000:
45  fps
med. 1920x1080
100%
T1000:
35.2  fps
high 1920x1080
100%
T1000:
30.2  fps
ultra 1920x1080
100%
T1000:
29.5  fps
F1 23

F1 23

2023
low 1920x1080
100%
T1000:
108.3  fps
med. 1920x1080
100%
T1000:
96.5  fps
high 1920x1080
100%
T1000:
63.6  fps
low 1920x1080
100%
T1000:
69.2  fps
med. 1920x1080
100%
T1000:
55.6  fps
high 1920x1080
100%
T1000:
35.3  fps
ultra 1920x1080
100%
T1000:
27.6  fps
low 1920x1080
100%
T1000:
125.4  fps
med. 1920x1080
100%
T1000:
91.3  fps
high 1920x1080
100%
T1000:
69.6  fps
ultra 1920x1080
100%
T1000:
49.7  fps
low 1920x1080
100%
T1000:
51.8  fps
med. 1920x1080
100%
T1000:
42.5  fps
high 1920x1080
100%
T1000:
33.5  fps
ultra 1920x1080
100%
T1000:
21.4  fps
Far Cry 6

Far Cry 6

2021
low 1280x720
100%
T1000:
110.4  fps
med. 1920x1080
100%
T1000:
56.9  fps
high 1920x1080
100%
T1000:
47.4  fps
ultra 1920x1080
100%
T1000:
40.3  fps
low 1280x720
Quadro T1000 (Laptop):
190.9  fps
med. 1920x1080
Quadro T1000 (Laptop):
91.8  fps
high 1920x1080
Quadro T1000 (Laptop):
58.4  fps
ultra 1920x1080
Quadro T1000 (Laptop):
43.5  fps
low 1280x720
Quadro T1000 (Laptop):
150  fps
med. 1920x1080
Quadro T1000 (Laptop):
78  fps
high 1920x1080
Quadro T1000 (Laptop):
64.3  fps
low 1280x720
Quadro T1000 (Laptop):
134.1  fps
med. 1920x1080
Quadro T1000 (Laptop):
51  fps
high 1920x1080
Quadro T1000 (Laptop):
44.4  fps
low 1280x720
Quadro T1000 (Laptop):
121.4  fps
med. 1920x1080
Quadro T1000 (Laptop):
87.9  fps
high 1920x1080
Quadro T1000 (Laptop):
67.8  fps
ultra 1920x1080
Quadro T1000 (Laptop):
56  fps
low 1280x720
Quadro T1000 (Laptop):
87.9  fps
med. 1920x1080
Quadro T1000 (Laptop):
46.7  fps
high 1920x1080
Quadro T1000 (Laptop):
29.9  fps
ultra 1920x1080
Quadro T1000 (Laptop):
19.4  fps
med. 1920x1080
Quadro T1000 (Laptop):
67.3  fps
high 1920x1080
Quadro T1000 (Laptop):
57.6  fps
ultra 1920x1080
Quadro T1000 (Laptop):
50.4  fps
low 1280x720
Quadro T1000 (Laptop):
86  fps
med. 1920x1080
Quadro T1000 (Laptop):
60.5  fps
high 1920x1080
Quadro T1000 (Laptop):
51.9  fps
ultra 1920x1080
Quadro T1000 (Laptop):
46.9  fps
low 1280x720
Quadro T1000 (Laptop):
96.7  fps
med. 1920x1080
Quadro T1000 (Laptop):
61.2  fps
high 1920x1080
Quadro T1000 (Laptop):
50.8  fps
ultra 1920x1080
Quadro T1000 (Laptop):
44  fps
GRID 2019

GRID 2019

2019
low 1280x720
Quadro T1000 (Laptop):
125.4  fps
med. 1920x1080
Quadro T1000 (Laptop):
76.8  fps
high 1920x1080
Quadro T1000 (Laptop):
65.2  fps
ultra 1920x1080
Quadro T1000 (Laptop):
42.8  fps
low 1280x720
Quadro T1000 (Laptop):
93  fps
med. 1920x1080
Quadro T1000 (Laptop):
53  fps
high 1920x1080
Quadro T1000 (Laptop):
47  fps
ultra 1920x1080
Quadro T1000 (Laptop):
32  fps
FIFA 20

FIFA 20

2019
low 1280x720
Quadro T1000 (Laptop):
208  fps
med. 1920x1080
Quadro T1000 (Laptop):
171.3  fps
high 1920x1080
Quadro T1000 (Laptop):
160.3  fps
ultra 1920x1080
Quadro T1000 (Laptop):
148.9  fps
low 1280x720
100%
T1000:
151  fps
78%
Quadro T1000 (Laptop):
117.9  fps
med. 1920x1080
100%
T1000:
60  fps
98%
Quadro T1000 (Laptop):
58.7  fps
high 1920x1080
100%
T1000:
38.2  fps
99%
Quadro T1000 (Laptop):
38  fps
ultra 1920x1080
100%
T1000:
28.6  fps
100%
Quadro T1000 (Laptop):
28.5  fps
Control

Control

2019
low 1280x720
Quadro T1000 (Laptop):
136.8  fps
med. 1920x1080
Quadro T1000 (Laptop):
42.4  fps
high 1920x1080
Quadro T1000 (Laptop):
31.2  fps
F1 2019

F1 2019

2019
low 1280x720
Quadro T1000 (Laptop):
118 178 ~ 148 fps
med. 1920x1080
Quadro T1000 (Laptop):
73 105 ~ 89 fps
high 1920x1080
Quadro T1000 (Laptop):
61 92 ~ 77 fps
ultra 1920x1080
Quadro T1000 (Laptop):
49 79 ~ 64 fps
low 1280x720
100%
T1000:
195.9  fps
95%
Quadro T1000 (Laptop):
182.3 189 ~ 186 fps
med. 1920x1080
100%
T1000:
60  fps
102%
Quadro T1000 (Laptop):
60.4 62.5 ~ 61 fps
high 1920x1080
100%
T1000:
37.3  fps
102%
Quadro T1000 (Laptop):
37.5 39.1 ~ 38 fps
ultra 1920x1080
100%
T1000:
24.1  fps
104%
Quadro T1000 (Laptop):
24.7 25.6 ~ 25 fps
Rage 2

Rage 2

2019
low 1280x720
Quadro T1000 (Laptop):
123.7  fps
med. 1920x1080
Quadro T1000 (Laptop):
55.2  fps
high 1920x1080
Quadro T1000 (Laptop):
45.7  fps
ultra 1920x1080
Quadro T1000 (Laptop):
45.1  fps
Anno 1800

Anno 1800

2019
low 1280x720
Quadro T1000 (Laptop):
69.6 94.5 ~ 82 fps
med. 1920x1080
Quadro T1000 (Laptop):
52.8 73.4 ~ 63 fps
high 1920x1080
Quadro T1000 (Laptop):
37.2 45.2 ~ 41 fps
ultra 1920x1080
Quadro T1000 (Laptop):
20 23.1 ~ 22 fps
low 1280x720
Quadro T1000 (Laptop):
111  fps
med. 1920x1080
Quadro T1000 (Laptop):
39 61 ~ 50 fps
high 1920x1080
Quadro T1000 (Laptop):
36 48 ~ 42 fps
ultra 1920x1080
Quadro T1000 (Laptop):
29 35 ~ 32 fps
low 1280x720
Quadro T1000 (Laptop):
185.2 232.8 ~ 209 fps
med. 1920x1080
Quadro T1000 (Laptop):
80.7 100.5 ~ 91 fps
high 1920x1080
Quadro T1000 (Laptop):
63.7 79.4 ~ 72 fps
ultra 1920x1080
Quadro T1000 (Laptop):
36.3 42.5 ~ 39 fps
low 1280x720
100%
T1000:
117  fps
66%
Quadro T1000 (Laptop):
77  fps
med. 1920x1080
100%
T1000:
62  fps
77%
Quadro T1000 (Laptop):
48  fps
high 1920x1080
100%
T1000:
58  fps
79%
Quadro T1000 (Laptop):
46  fps
ultra 1920x1080
100%
T1000:
53  fps
81%
Quadro T1000 (Laptop):
43  fps
low 1280x720
100%
T1000:
102.3  fps
91%
Quadro T1000 (Laptop):
93.3  fps
med. 1920x1080
100%
T1000:
45.9  fps
95%
Quadro T1000 (Laptop):
43.4  fps
high 1920x1080
100%
T1000:
33  fps
97%
Quadro T1000 (Laptop):
31.9  fps
ultra 1920x1080
100%
T1000:
26.1  fps
98%
Quadro T1000 (Laptop):
25.5  fps
low 1280x720
Quadro T1000 (Laptop):
143.7 144 ~ 144 fps
med. 1920x1080
Quadro T1000 (Laptop):
73.8 92.7 ~ 83 fps
high 1920x1080
Quadro T1000 (Laptop):
57.8 69 ~ 63 fps
ultra 1920x1080
Quadro T1000 (Laptop):
55.9 68.7 ~ 62 fps
low 1280x720
Quadro T1000 (Laptop):
61.5 138.1 ~ 100 fps
med. 1920x1080
Quadro T1000 (Laptop):
43.2 76.5 ~ 60 fps
high 1920x1080
Quadro T1000 (Laptop):
37.8 66.6 ~ 52 fps
ultra 1920x1080
Quadro T1000 (Laptop):
35 59.4 ~ 47 fps
low 1280x720
Quadro T1000 (Laptop):
182.4  fps
med. 1920x1080
Quadro T1000 (Laptop):
106.7  fps
high 1920x1080
Quadro T1000 (Laptop):
86.3  fps
ultra 1920x1080
Quadro T1000 (Laptop):
66.5  fps
low 1280x720
Quadro T1000 (Laptop):
57 82 ~ 70 fps
med. 1920x1080
Quadro T1000 (Laptop):
40 55 ~ 48 fps
high 1920x1080
Quadro T1000 (Laptop):
35 50 ~ 43 fps
ultra 1920x1080
Quadro T1000 (Laptop):
29 29 ~ 29 fps
FIFA 19

FIFA 19

2018
low 1280x720
Quadro T1000 (Laptop):
148  fps
med. 1920x1080
Quadro T1000 (Laptop):
119.2  fps
high 1920x1080
Quadro T1000 (Laptop):
113.5  fps
ultra 1920x1080
Quadro T1000 (Laptop):
110.8  fps
low 1280x720
Quadro T1000 (Laptop):
88 101 111 ~ 100 fps
med. 1920x1080
Quadro T1000 (Laptop):
46 56.7 58 ~ 54 fps
high 1920x1080
Quadro T1000 (Laptop):
40 50 54.1 ~ 48 fps
ultra 1920x1080
Quadro T1000 (Laptop):
35 45 46 ~ 42 fps
Strange Brigade

Strange Brigade

2018
low 1280x720
100%
T1000:
226  fps
med. 1920x1080
100%
T1000:
87.2  fps
high 1920x1080
100%
T1000:
69.4  fps
ultra 1920x1080
100%
T1000:
59.9  fps
Far Cry 5

Far Cry 5

2018
low 1280x720
100%
T1000:
127  fps
84%
Quadro T1000 (Laptop):
107  fps
med. 1920x1080
100%
T1000:
62  fps
100%
Quadro T1000 (Laptop):
62  fps
high 1920x1080
100%
T1000:
57  fps
100%
Quadro T1000 (Laptop):
57  fps
ultra 1920x1080
100%
T1000:
53  fps
100%
Quadro T1000 (Laptop):
53  fps
World of Tanks enCore

World of Tanks enCore

2018
low 1366x768
Quadro T1000 (Laptop):
491.9  fps
med. 1920x1080
Quadro T1000 (Laptop):
199.3  fps
ultra 1920x1080
Quadro T1000 (Laptop):
77.1  fps
low 1280x720
100%
T1000:
211  fps
44%
Quadro T1000 (Laptop):
79.7 91 108 ~ 93 fps
med. 1920x1080
100%
T1000:
145.8  fps
55%
Quadro T1000 (Laptop):
66.2 78 96 ~ 80 fps
high 1920x1080
100%
T1000:
130.1  fps
53%
Quadro T1000 (Laptop):
57.1 69 80.1 ~ 69 fps
low 1280x720
Quadro T1000 (Laptop):
93.7  fps
med. 1920x1080
Quadro T1000 (Laptop):
49.3  fps
high 1920x1080
Quadro T1000 (Laptop):
40.5  fps
ultra 1920x1080
Quadro T1000 (Laptop):
30.7  fps
low 1280x720
100%
T1000:
101.3  fps
66%
Quadro T1000 (Laptop):
56.1 77.4 ~ 67 fps
med. 1920x1080
100%
T1000:
49.3  fps
93%
Quadro T1000 (Laptop):
41.9 49.2 ~ 46 fps
high 1920x1080
100%
T1000:
36.2  fps
91%
Quadro T1000 (Laptop):
31.1 34 ~ 33 fps
low 1280x720
Quadro T1000 (Laptop):
246.4  fps
med. 1920x1080
Quadro T1000 (Laptop):
150.7  fps
high 1920x1080
Quadro T1000 (Laptop):
117  fps
low 1280x720
Quadro T1000 (Laptop):
94  fps
med. 1920x1080
Quadro T1000 (Laptop):
47.2  fps
high 1920x1080
Quadro T1000 (Laptop):
43.9  fps
ultra 1920x1080
Quadro T1000 (Laptop):
24.2  fps
For Honor

For Honor

2017
low 1280x720
Quadro T1000 (Laptop):
163.4 199.8 ~ 182 fps
med. 1920x1080
Quadro T1000 (Laptop):
66.7 77.5 ~ 72 fps
high 1920x1080
Quadro T1000 (Laptop):
63.9 74.3 ~ 69 fps
ultra 1920x1080
Quadro T1000 (Laptop):
48.8 56.7 ~ 53 fps
low 1024x768
Quadro T1000 (Laptop):
136.2  fps
med. 1366x768
Quadro T1000 (Laptop):
86  fps
high 1920x1080
Quadro T1000 (Laptop):
53.4  fps
ultra 1920x1080
Quadro T1000 (Laptop):
43.8  fps
low 1024x768
Quadro T1000 (Laptop):
190.3 244.3 ~ 217 fps
med. 1366x768
Quadro T1000 (Laptop):
159.6 197.9 ~ 179 fps
high 1920x1080
Quadro T1000 (Laptop):
111.6 139.3 ~ 125 fps
ultra 1920x1080
Quadro T1000 (Laptop):
97.9 117.9 ~ 108 fps
low 1280x720
100%
T1000:
246.2  fps
58%
Quadro T1000 (Laptop):
134 141.4 151 ~ 142 fps
med. 1366x768
100%
T1000:
217.7  fps
57%
Quadro T1000 (Laptop):
115 124.8 136 ~ 125 fps
high 1920x1080
100%
T1000:
150.4  fps
78%
Quadro T1000 (Laptop):
113 113.6 123 ~ 117 fps
ultra 1920x1080
100%
T1000:
136.5  fps
80%
Quadro T1000 (Laptop):
106 106.7 115 ~ 109 fps
4K 3840x2160
Quadro T1000 (Laptop):
47.9  fps
low 1024x768
100%
T1000:
188.8  fps
95%
Quadro T1000 (Laptop):
156.2 189 190.7 ~ 179 fps
med. 1366x768
100%
T1000:
113.8  fps
95%
Quadro T1000 (Laptop):
94.1 114 115.9 ~ 108 fps
high 1920x1080
100%
T1000:
63.9  fps
92%
Quadro T1000 (Laptop):
52.7 62.8 62.9 ~ 59 fps
ultra 1920x1080
100%
T1000:
35.2  fps
99%
Quadro T1000 (Laptop):
30.9 35 37.9 ~ 35 fps
GTA V

GTA V

2015
low 1024x768
100%
T1000:
187.4  fps
91%
Quadro T1000 (Laptop):
170.1  fps
med. 1366x768
100%
T1000:
187.1  fps
82%
Quadro T1000 (Laptop):
153.9  fps
high 1920x1080
100%
T1000:
103.5  fps
91%
Quadro T1000 (Laptop):
93.8  fps
ultra 1920x1080
100%
T1000:
50.2  fps
83%
Quadro T1000 (Laptop):
41.7  fps
low 1280x720
Quadro T1000 (Laptop):
280.4 316.4 ~ 298 fps
med. 1366x768
Quadro T1000 (Laptop):
210 241 ~ 226 fps
high 1366x768
Quadro T1000 (Laptop):
184.7 216.3 ~ 201 fps
ultra 1920x1080
Quadro T1000 (Laptop):
72.9 86.6 ~ 80 fps

Average Gaming NVIDIA T1000 → 100%

Average Gaming 30-70 fps → 100%

Average Gaming NVIDIA Quadro T1000 (Laptop) → 85%

Average Gaming 30-70 fps → 90%

NVIDIA T1000NVIDIA Quadro RTX 6000 (Laptop)NVIDIA Quadro T1000 (Laptop)
lowmed.highultraQHD4Klowmed.highultraQHD4Klowmed.highultraQHD4K
F1 2498.482.658.8
Avatar Frontiers of Pandora22191510
Total War Pharaoh138.690.850.639.8
Assassin's Creed Mirage444038
Cyberpunk 2077 2.2 Phantom Liberty45.134.228.323.8
Baldur's Gate 34535.230.229.5
F1 23108.396.563.6
Tiny Tina's Wonderlands69.255.635.327.6
GRID Legends125.491.369.649.7
God of War51.842.533.521.4
Far Cry 6110.456.947.440.3
Borderlands 31516038.228.6117.958.73828.5
Total War: Three Kingdoms195.96037.324.1186613825
Far Cry New Dawn11762585377484643
Metro Exodus102.345.93326.193.343.431.925.5
Strange Brigade22687.269.459.9
Far Cry 5127625753107625753
X-Plane 11.11211145.8130.1938069
Final Fantasy XV Benchmark101.349.336.2674633
Dota 2 Reborn246.2217.7150.4136.514212511710947.9
The Witcher 3188.8113.863.935.21791085935
GTA V187.4187.1103.550.2170.1153.993.841.7
NVIDIA T1000NVIDIA Quadro RTX 6000 (Laptop)NVIDIA Quadro T1000 (Laptop)
lowmed.highultraQHD4Klowmed.highultraQHD4Klowmed.highultraQHD4K
< 30 fps
< 60 fps
< 120 fps
≥ 120 fps
1
4
7
10
1
8
10
3
2
13
5
2
8
8

1


< 30 fps
< 60 fps
< 120 fps
≥ 120 fps


< 30 fps
< 60 fps
< 120 fps
≥ 120 fps


6
4

4
4
2

7
3
3
4
1


1

For more games that might be playable and a list of all games and graphics cards visit our Gaming List

v1.33
log 25. 21:00:06

#0 ran 0s before starting gpusingle class +0s ... 0s

#1 checking url part for id 12782 +0s ... 0s

#2 checking url part for id 9923 +0s ... 0s

#3 checking url part for id 9860 +0s ... 0s

#4 not redirecting to Ajax server +0s ... 0s

#5 did not recreate cache, as it is less than 5 days old! Created at Fri, 25 Apr 2025 05:16:28 +0200 +0s ... 0s

#6 composed specs +0.003s ... 0.003s

#7 did output specs +0s ... 0.003s

#8 start showIntegratedCPUs +0s ... 0.003s

#9 getting avg benchmarks for device 12782 +0.001s ... 0.005s

#10 got single benchmarks 12782 +0.001s ... 0.005s

#11 getting avg benchmarks for device 9923 +0s ... 0.005s

#12 got single benchmarks 9923 +0s ... 0.006s

#13 getting avg benchmarks for device 9860 +0.003s ... 0.009s

#14 got single benchmarks 9860 +0.001s ... 0.01s

#15 got avg benchmarks for devices +0s ... 0.01s

#16 min, max, avg, median took s +0.026s ... 0.035s

#17 before gaming benchmark output +0s ... 0.035s

#18 Got 316 rows for game benchmarks. +0.012s ... 0.048s

#19 composed SQL query for gamebenchmarks +0s ... 0.048s

#20 got data and put it in $dataArray +0.003s ... 0.051s

#21 benchmarks composed for output. +0.017s ... 0.067s

#22 calculated avg scores. +0s ... 0.067s

#23 return log +0.001s ... 0.068s

Please share our article, every link counts!
Mail Logo
> Expert Reviews and News on Laptops, Smartphones and Tech Innovations > Benchmarks / Tech > Graphics Card Comparison - Head 2 Head
Redaktion, 2017-09- 8 (Update: 2023-07- 1)