Notebookcheck Logo

Intel Core i9-13900K vs Intel Core i5-13500 vs Intel Core i5-13600K

Intel Core i9-13900K

► remove from comparison Intel i9-13900K

The Intel Core i9-13900K is a fast high-end desktop processor of the Raptor Lake series. It includes a hybrid architecture for the CPU cores with combined 24 cores and 32 threads. Eight fast Raptor Cove performance cores (P-cores) with HyperThreading and a clock speed of 3 - 5.8 GHz and sixteen Gracemont efficiency cores without HyperThreading and a clock speed of 2.2 - 4.3 GHz.

Thanks to the faster P-cores and more E-cores, the i9-13900K is significantly faster than the old i9-12900K (especially in multi-threaded workloads). Compared to the Raphael AMD Ryzen 9 7950X (Zen 4), the 13900K offers a slightly higher multi-thread-performance and a slightly lower single core performance. In games, the Intel CPU is currently the clear winner (at the time of announcement of the 7950X).

The 13900K is rated at 125 Watt TDP base power (PL1) and 253 Watt Turbo Power (PL2) and therefore slightly higher than the old i9-12900K.

Intel Core i5-13500

► remove from comparison Intel i5-13500

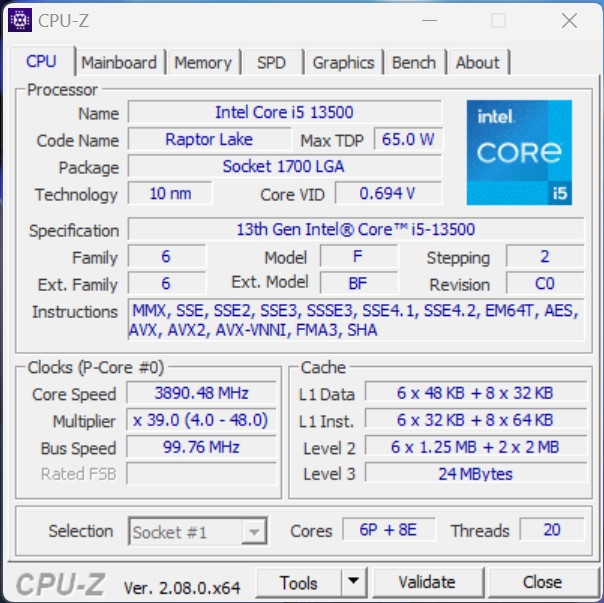
The Intel Core i5-13500 is a fast and relatively power efficient desktop processor based on the Raptor Lake architecture, which was introduced in October 2022. The processor offers a base clock of 2.5 GHz and reaches up to 4.8 GHz in Turbo. The hybrid CPU architecture introduced with Alder Lake is also used in the Raptor Lake processors. Compared to the Intel Core i5-12500, the Intel Core i5-13500 offers more cores, which means a higher overall performance can be achieved. In total, the Intel Core i5-13500 can process up to 20 threads in parallel. The performance cores (P cores) offer hyperthreading for this purpose, which is withheld from the energy-efficient cores (E cores).

Performance

Due to the higher number of physical computing units, the Intel Core i5-13500 offers noticeably more performance compared to the Intel Core i5-12500. Both processors have 6 P-cores, although only the Intel Core i5-13500 is additionally equipped with 8 E-cores.

Graphics unit

Like the Intel Core i5-12600K, the Intel Core i5-13500 offers an integrated graphics unit. The Intel Iris Xe architecture continues to serve as the basis. In terms of performance, however, not much has changed with the new Intel UHD Graphics 770.

Power consumption

The TDP of the Intel Core i5-13500 is 65 watts, with the option to increase this to up to 154 watts in Turbo mode. Compared to the Intel Core i5-12500, the energy requirement increases slightly.

Intel Core i5-13600K

► remove from comparison Intel i5-13600K

The Intel Core i5-13600K is a fast mid-range desktop processor of the Raptor Lake series. It includes a hybrid architecture for the CPU cores with combined 14 cores. Six fast Raptor Cove performance cores (P-cores) with HyperThreading and a clock speed of 3.5 - 5.1 GHz and eight Gracemont efficiency cores without HyperThreading and a clock speed of 2.6 - 3.9 GHz.

Thanks to the faster P-cores and more E-cores, the i5-13600K is significantly faster than the old i5-12600K (especially in multi-threaded workloads. 

The 13600K is rated at 125 Watt TDP base power (PL1) and 181 Watt Turbo Power (PL2) and therefore slightly higher than the old Core i5-12600K.

ModelIntel Core i9-13900KIntel Core i5-13500Intel Core i5-13600K
CodenameRaptor LakeRaptor LakeRaptor Lake
SeriesIntel Raptor Lake-SIntel Raptor Lake-SIntel Raptor Lake-S
Series: Raptor Lake-S Raptor Lake
Intel Core i9-13900K « 3 - 5.8 GHz24 / 32 cores36 MB L3
Intel Core i7-13700K3.4 - 5.4 GHz16 / 24 cores30 MB L3
Intel Core i5-13600K3.5 - 5.1 GHz14 / 20 cores24 MB L3
Intel Core i5-135002.5 - 4.8 GHz14 / 20 cores24 MB L3
Intel Core i5-13500T1.6 - 4.6 GHz14 / 20 cores24 MB L3
Intel Core i9-13900K3 - 5.8 GHz24 / 32 cores36 MB L3
Intel Core i7-13700K3.4 - 5.4 GHz16 / 24 cores30 MB L3
Intel Core i5-13600K3.5 - 5.1 GHz14 / 20 cores24 MB L3
Intel Core i5-13500 « 2.5 - 4.8 GHz14 / 20 cores24 MB L3
Intel Core i5-13500T1.6 - 4.6 GHz14 / 20 cores24 MB L3
Intel Core i9-13900K3 - 5.8 GHz24 / 32 cores36 MB L3
Intel Core i7-13700K3.4 - 5.4 GHz16 / 24 cores30 MB L3
Intel Core i5-13600K « 3.5 - 5.1 GHz14 / 20 cores24 MB L3
Intel Core i5-135002.5 - 4.8 GHz14 / 20 cores24 MB L3
Intel Core i5-13500T1.6 - 4.6 GHz14 / 20 cores24 MB L3
Clock3000 - 5800 MHz2500 - 4800 MHz3500 - 5100 MHz
L2 Cache32 MB11.5 MB20 MB
L3 Cache36 MB24 MB24 MB
Cores / Threads24 / 32
8 x 5.8 GHz Intel Raptor Cove P-Core
16 x 4.3 GHz Intel Gracemont E-Core
14 / 20
6 x 4.8 GHz Intel Raptor Cove P-Core
8 x 3.5 GHz Intel Gracemont E-Core
14 / 20
6 x 5.1 GHz Intel Raptor Cove P-Core
8 x 3.9 GHz Intel Gracemont E-Core
TDP125 Watt65 Watt125 Watt
Technology10 nm10 nm10 nm
Die Size257 mm2215 mm2257 mm2
max. Temp.100 °C100 °C100 °C
SocketLGA 1700LGA 1700LGA 1700
FeaturesIntel UHD Graphics 770, DDR5 5600 MT/s, DDR4 3200 MT/sIntel UHD Graphics 770, DDR5 4800 MT/s, DDR4 3200 MT/sIntel UHD Graphics 770, DDR5 5600 MT/s, DDR4 3200 MT/s
iGPUIntel UHD Graphics 770 (300 - 1650 MHz)Intel UHD Graphics 770 (300 - 1550 MHz)Intel UHD Graphics 770 (300 - 1500 MHz)
Architecturex86x86x86
$589 U.S.$319 U.S.
Announced
Manufacturerwww.intel.comwww.intel.dewww.intel.com
TDP Turbo PL2154 Watt

Benchmarks

Performance Rating - CB R15 + R20 + 7-Zip + X265 + Blender + 3DM11 CPU - i9-13900K
49 pt (82%)
Restrict / Search: Model: Max. age: years
Performance Rating - CB R15 + R20 + 7-Zip + X265 + Blender + 3DM11 CPU - i5-13500
38.3 pt (64%)
Restrict / Search: Model: Max. age: years
Performance Rating - CB R15 + R20 + 7-Zip + X265 + Blender + 3DM11 CPU - i5-13600K
42.9 pt (71%)
Restrict / Search: Model: Max. age: years
Cinebench 2024 - Cinebench 2024 CPU Single Core
107 Points (60%)
Cinebench 2024 - Cinebench 2024 CPU Multi Core
822 Points (15%)
Cinebench R23 - Cinebench R23 Multi Core
min: 32592     avg: 37310     median: 38271.5 (36%)     max: 40103 Points
14573 Points (14%)
min: 24174     avg: 24221     median: 24221 (22%)     max: 24268 Points
Cinebench R23 - Cinebench R23 Single Core
min: 2203     avg: 2238     median: 2238.5 (95%)     max: 2272 Points
1780 Points (76%)
min: 1991     avg: 2001     median: 2000.5 (85%)     max: 2010 Points
Cinebench R20 - Cinebench R20 CPU (Single Core)
min: 828     avg: 849     median: 849.5 (94%)     max: 870 Points
685 Points (76%)
min: 766     avg: 771     median: 770.5 (85%)     max: 775 Points
Cinebench R20 - Cinebench R20 CPU (Multi Core)
min: 13415     avg: 14459     median: 14620.5 (36%)     max: 15181 Points
5633 Points (14%)
min: 9217     avg: 9241     median: 9241 (23%)     max: 9265 Points
Cinebench R15 - Cinebench R15 CPU Multi 64 Bit
min: 5321     avg: 5798     median: 5805.5 (37%)     max: 6191 Points
2405 Points (15%)
min: 3641     avg: 3642     median: 3642 (23%)     max: 3643 Points
Cinebench R15 - Cinebench R15 CPU Single 64 Bit
min: 299     avg: 314.1     median: 318 (89%)     max: 328 Points
256 Points (72%)
min: 286     avg: 287.5     median: 287.5 (81%)     max: 289 Points
Cinebench R11.5 - Cinebench R11.5 CPU Multi 64 Bit
min: 62.2     avg: 67     median: 67.5 (87%)     max: 70.78 Points
28.4 Points (37%)
min: 42.2     avg: 42.3     median: 42.3 (55%)     max: 42.38 Points
Cinebench R11.5 - Cinebench R11.5 CPU Single 64 Bit
min: 3.8     avg: 3.9     median: 3.9 (92%)     max: 3.93 Points
3.1 Points (74%)
min: 3.45     avg: 3.5     median: 3.5 (82%)     max: 3.48 Points
Cinebench R10 - Cinebench R10 Rend. Single (32bit)
min: 11661     avg: 11989     median: 12017.5 (73%)     max: 12259 Points
8875 Points (54%)
min: 10710     avg: 10755     median: 10754.5 (65%)     max: 10799 Points
Cinebench R10 - Cinebench R10 Rend. Multi (32bit)
min: 85342     avg: 88253     median: 87738 (64%)     max: 92192 Points
49300 Points (36%)
min: 67973     avg: 68880     median: 68879.5 (50%)     max: 69786 Points
Cinebench R10 - Cinebench R10 Rend. Multi (64bit)
min: 132000     avg: 134526     median: 133567 (85%)     max: 138969 Points
79625 Points (51%)
min: 110412     avg: 110969     median: 110969 (71%)     max: 111526 Points
Cinebench R10 - Cinebench R10 Rend. Single (64bit)
min: 17418     avg: 17943     median: 17998.5 (22%)     max: 18355 Points
14282 Points (17%)
min: 16074     avg: 16155     median: 16154.5 (20%)     max: 16235 Points
wPrime 2.10 - wPrime 2.0 1024m *
min: 79.738     avg: 84.6     median: 84.2 (1%)     max: 90.13 s
100.7 s (1%)
min: 172.189     avg: 174.9     median: 174.9 (2%)     max: 177.592 s
wPrime 2.10 - wPrime 2.0 32m *
min: 1.818     avg: 2.1     median: 2 (0%)     max: 2.305 s
4 s (1%)
min: 2.518     avg: 2.5     median: 2.5 (1%)     max: 2.527 s
WinRAR - WinRAR 4.0
min: 13210     avg: 14265     median: 14271 (23%)     max: 15309 Points
7704 Points (12%)
min: 10937     avg: 10967     median: 10967 (17%)     max: 10997 Points
7-Zip 18.03 - 7-Zip 18.03 Multi Thread 4 runs
min: 127201     avg: 142777     median: 146984 (84%)     max: 148053 MIPS
55528 MIPS (32%)
min: 89527     avg: 89587     median: 89587 (51%)     max: 89647 MIPS
7-Zip 18.03 - 7-Zip 18.03 Single Thread 4 runs
min: 7176     avg: 7343     median: 7272 (86%)     max: 7539 MIPS
5887 MIPS (69%)
min: 6253     avg: 6378     median: 6377.5 (75%)     max: 6502 MIPS
X264 HD Benchmark 4.0 - x264 Pass 2
min: 247.5     avg: 261.5     median: 264.8 (89%)     max: 269 fps
134.6 fps (45%)
min: 198.6     avg: 198.8     median: 198.8 (66%)     max: 199 fps
X264 HD Benchmark 4.0 - x264 Pass 1
min: 412     avg: 419     median: 419.3 (97%)     max: 425.5 fps
306 fps (71%)
min: 387     avg: 387.5     median: 387.5 (89%)     max: 388 fps
HWBOT x265 Benchmark v2.2 - HWBOT x265 4k Preset
min: 34.5     avg: 39.9     median: 40.7 (72%)     max: 42.6 fps
16.3 fps (29%)
min: 27.5     avg: 27.6     median: 27.6 (48%)     max: 27.6 fps
TrueCrypt - TrueCrypt Serpent
min: 2.6     avg: 2.9     median: 2.9 (85%)     max: 3 GB/s
1.3 GB/s (38%)
1.7 GB/s (50%)
TrueCrypt - TrueCrypt Twofish
min: 5.2     avg: 5.4     median: 5.4 (93%)     max: 5.4 GB/s
2.3 GB/s (40%)
min: 3.1     avg: 3.2     median: 3.2 (54%)     max: 3.2 GB/s
TrueCrypt - TrueCrypt AES
min: 20.5     avg: 23.3     median: 22.9 (60%)     max: 27 GB/s
12 GB/s (31%)
min: 18.8     avg: 19.1     median: 19.1 (50%)     max: 19.4 GB/s
Blender - Blender 3.3 Classroom CPU *
min: 136     avg: 145.2     median: 140.5 (2%)     max: 174 Seconds
399 Seconds (5%)
224 Seconds (3%)
Blender - Blender 2.79 BMW27 CPU *
min: 80     avg: 85.7     median: 84 (1%)     max: 101 Seconds
223 Seconds (2%)
135 Seconds (1%)
R Benchmark 2.5 - R Benchmark 2.5 *
min: 0.3468     avg: 0.4     median: 0.4 (8%)     max: 0.3911 sec
0.4 sec (10%)
min: 0.4048     avg: 0.4     median: 0.4 (9%)     max: 0.405 sec
3DMark 06 - CPU - 3DMark 06 - CPU
min: 19989     avg: 20578     median: 20192 (43%)     max: 21934 Points
14875 Points (32%)
17627 Points (38%)
Super Pi mod 1.5 XS 1M - Super Pi mod 1.5 XS 1M *
min: 5.655     avg: 5.7     median: 5.7 (1%)     max: 5.86 s
7.8 s (2%)
min: 6.471     avg: 6.5     median: 6.5 (1%)     max: 6.58 s
Super Pi mod 1.5 XS 2M - Super Pi mod 1.5 XS 2M *
min: 12.287     avg: 12.6     median: 12.5 (1%)     max: 13.193 s
17.2 s (1%)
min: 14.876     avg: 14.9     median: 14.9 (1%)     max: 14.993 s
Super Pi Mod 1.5 XS 32M - Super Pi mod 1.5 XS 32M *
min: 289.628     avg: 296.6     median: 293.3 (1%)     max: 310.125 s
min: 328.929     avg: 331.4     median: 331.4 (1%)     max: 333.798 s
3DMark Vantage - 3DM Vant. Perf. CPU no Physx
min: 86915     avg: 97290     median: 96473 (74%)     max: 112434 Points
69725 Points (54%)
97718 Points (75%)
3DMark 11 - 3DM11 Performance Physics
min: 29023     avg: 31289     median: 31187.5 (78%)     max: 33181 Points
18026 Points (45%)
min: 30358     avg: 30419     median: 30419 (76%)     max: 30480 Points
3DMark - 3DMark Ice Storm Physics
min: 79257     avg: 97847     median: 97246.5 (79%)     max: 111988 Points
84456 Points (69%)
min: 86734     avg: 86952     median: 86952 (71%)     max: 87170 Points
3DMark - 3DMark Ice Storm Extreme Physics
min: 80320     avg: 96904     median: 97919.5 (79%)     max: 102987 Points
83392 Points (68%)
min: 87784     avg: 87861     median: 87860.5 (71%)     max: 87937 Points
3DMark - 3DMark Ice Storm Unlimited Physics
min: 83056     avg: 98634     median: 97311 (81%)     max: 105981 Points
81778 Points (68%)
min: 88547     avg: 89321     median: 89321 (74%)     max: 90095 Points
3DMark - 3DMark Cloud Gate Physics
min: 26626     avg: 29034     median: 29044.5 (73%)     max: 30955 Points
17891 Points (45%)
min: 26359     avg: 26394     median: 26394 (67%)     max: 26429 Points
3DMark - 3DMark Fire Strike Standard Physics
min: 46013     avg: 51456     median: 51140 (91%)     max: 54226 Points
26263 Points (47%)
min: 35386     avg: 35395     median: 35395 (63%)     max: 35404 Points
3DMark - 3DMark Time Spy CPU
min: 16236     avg: 20507     median: 20037 (84%)     max: 22794 Points
9655 Points (41%)
min: 17079     avg: 17102     median: 17101.5 (72%)     max: 17124 Points
Geekbench 6.4 - Geekbench 6.4 Single-Core
3070 Points (77%)
2483 Points (62%)
Geekbench 6.4 - Geekbench 6.4 Multi-Core
20800 Points (81%)
10348 Points (40%)
Geekbench 6.0 - Geekbench 6.0 Single-Core
3105 Points (99%)
Geekbench 6.0 - Geekbench 6.0 Multi-Core
21003 Points (86%)
Geekbench 5.5 - Geekbench 5.1 - 5.5 64 Bit Single-Core
min: 2106     avg: 2237     median: 2286 (89%)     max: 2290 Points
1805 Points (71%)
min: 1967     avg: 1973     median: 1973 (77%)     max: 1979 Points
Geekbench 5.5 - Geekbench 5.1 - 5.5 64 Bit Multi-Core
min: 22448     avg: 23743     median: 24033 (43%)     max: 24157 Points
10322 Points (18%)
min: 16651     avg: 16671     median: 16670.5 (30%)     max: 16690 Points
Geekbench 5.0 - Geekbench 5.0 64 Bit Single-Core
min: 2148     avg: 2191     median: 2197 (10%)     max: 2246 Points
1749 Points (8%)
min: 1931     avg: 1948     median: 1947.5 (8%)     max: 1964 Points
Geekbench 5.0 - Geekbench 5.0 64 Bit Multi-Core
min: 22024     avg: 23446     median: 23664 (75%)     max: 24021 Points
10213 Points (32%)
min: 16497     avg: 16566     median: 16566 (52%)     max: 16635 Points
Geekbench 4.4 - Geekbench 4.1 - 4.4 64 Bit Single-Core
min: 9218     avg: 9542     median: 9598 (96%)     max: 9683 Points
7379 Points (74%)
min: 8618     avg: 8625     median: 8624.5 (86%)     max: 8631 Points
Geekbench 4.4 - Geekbench 4.1 - 4.4 64 Bit Multi-Core
min: 77347     avg: 84105     median: 85336 (85%)     max: 86695 Points
39094 Points (39%)
min: 60407     avg: 61014     median: 61014 (61%)     max: 61621 Points
Mozilla Kraken 1.1 - Kraken 1.1 Total Score *
min: 423     avg: 430.6     median: 432 (1%)     max: 438 ms
519 ms (1%)
min: 467     avg: 468     median: 468 (1%)     max: 469 ms
WebXPRT 4 - WebXPRT 4 Score
min: 304     avg: 317.6     median: 316 (87%)     max: 335 Points
254 Points (70%)
288 Points (79%)
WebXPRT 3 - WebXPRT 3 Score
min: 338     avg: 364     median: 368 (66%)     max: 382 Points
266 Points (48%)
min: 329     avg: 331     median: 331 (59%)     max: 333 Points
CrossMark - CrossMark Overall
min: 2263     avg: 2497     median: 2580 (96%)     max: 2589 Points
1549 Points (58%)
min: 2237     avg: 2254     median: 2254 (84%)     max: 2271 Points
Power Consumption - Prime95 Power Consumption - external Monitor *
min: 228     avg: 354.3     median: 359 (62%)     max: 471 Watt
98.7 Watt (17%)
min: 278     avg: 313     median: 313 (54%)     max: 348 Watt
Power Consumption - Cinebench R15 Multi Power Consumption - external Monitor *
min: 349     avg: 392.5     median: 370.5 (68%)     max: 480 Watt
121 Watt (22%)
min: 245     avg: 265.5     median: 265.5 (48%)     max: 286 Watt
1193%
1 i5-13500 +
7.9 Watt (5%)
min: 69.3     avg: 73.3     median: 73.3 (48%)     max: 77.3 Watt
Power Consumption - Power Efficiency - Cinebench R15 Multi external Monitor
min: 12.9     avg: 15     median: 15.2 (11%)     max: 16.8 Points per Watt
19.9 Points per Watt (15%)
min: 12.7     avg: 13.8     median: 13.8 (10%)     max: 14.9 Points per Watt

Average Benchmarks Intel Core i9-13900K → 100% n=47

Average Benchmarks Intel Core i5-13500 → 63% n=47

Average Benchmarks Intel Core i5-13600K → 80% n=47

- Range of benchmark values for this graphics card
red legend - Average benchmark values for this graphics card
* Smaller numbers mean a higher performance
1 This benchmark is not used for the average calculation

v1.33
log 15. 22:35:23

#0 ran 0s before starting gpusingle class +0s ... 0s

#1 checking url part for id 14625 +0s ... 0s

#2 checking url part for id 17901 +0s ... 0s

#3 checking url part for id 14626 +0s ... 0s

#4 not redirecting to Ajax server +0s ... 0s

#5 did not recreate cache, as it is less than 5 days old! Created at Tue, 13 May 2025 05:18:04 +0200 +0s ... 0s

#6 composed specs +0.006s ... 0.006s

#7 did output specs +0s ... 0.006s

#8 getting avg benchmarks for device 14625 +0.005s ... 0.012s

#9 got single benchmarks 14625 +0.023s ... 0.035s

#10 getting avg benchmarks for device 17901 +0.004s ... 0.039s

#11 got single benchmarks 17901 +0.004s ... 0.042s

#12 getting avg benchmarks for device 14626 +0.004s ... 0.046s

#13 got single benchmarks 14626 +0.005s ... 0.051s

#14 got avg benchmarks for devices +0s ... 0.051s

#15 min, max, avg, median took s +0.082s ... 0.132s

#16 return log +0s ... 0.132s

Please share our article, every link counts!
Mail Logo
> Expert Reviews and News on Laptops, Smartphones and Tech Innovations > Benchmarks / Tech > Processor Comparison - Head 2 Head
Redaktion, 2017-09- 8 (Update: 2023-07- 1)