Notebookcheck Logo

Intel Core i7-14700 vs Intel Core i9-14900 vs Intel Core i5-14500T

Intel Core i7-14700

► remove from comparison Intel i7-14700

The Intel Core i7-14700 is a desktop processor based on the Raptor Lake architecture, which inherits the 13th generation of Intel Core processors with minor improvements. The processor offers a base clock of 1.5 GHz or 2.1 GHz and reaches up to 5.4 GHz in Turbo. The basic CPU structure remains unchanged. The Intel Core i7-14700 features 8 P-cores and 12 E-cores, allowing up to 28 threads to be processed in parallel. It is also based on the LGA 1700 socket, which was already introduced with Alder Lake.

Graphics unit

Like the Intel Core i7-13700K, the Intel Core i7-14700 also has an integrated graphics unit. The Intel Iris Xe architecture continues to serve as the basis. In terms of performance, however, nothing has changed with the Intel UHD Graphics 770.

Power consumption

The TDP of the Intel Core i7-14700 is 65 watts, with the option of consuming up to 219 watts in Turbo mode.

Intel Core i9-14900

► remove from comparison Intel i9-14900

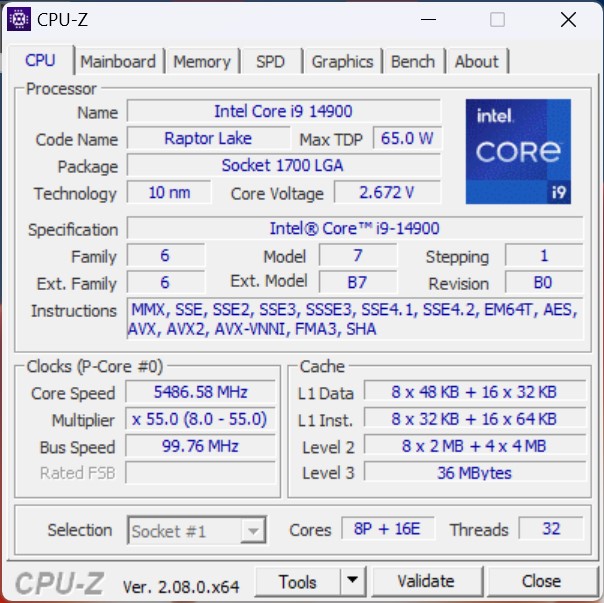
The Intel Core i9-14900 is a high-end processor based on the Raptor Lake architecture. The base clock is 2 GHz and can reach up to 5.8 GHz under optimal conditions. Similar to the top model (Intel Core i9-14900K), the total of 32 threads are divided into 8 p- and 16 e-cores. The 8 performance cores (p-cores) also offer hyperthreading, which means that a total of 32 threads can be processed simultaneously. The non-K model is an economical processor. There is still the option of DDR4 or DDR5 memory.

Performance

Compared to the Intel Core i9-14900K, the Core i9-14900 offers the same number of physical computing units. However, due to the lower power consumption, the Intel Core i9-14900 delivers slightly less performance. The intended use is primarily for compact PCs with limited cooling options.

Graphics unit

Like the Intel Core i9-14900K, the Intel Core i9-14900 offers an integrated graphics unit. The Intel Iris Xe architecture continues to serve as the basis. In terms of performance, however, nothing has changed with the Intel UHD Graphics 770.

Power consumption

The Intel Core i9-14900 is specified with a TDP of 65 watts, which corresponds to the PL1 value. In boost mode, the processor's performance can increase to up to 219 watts (PL2). However, this requires very good cooling. Compared to the Intel Core i9-13900, the specified power consumption has not changed.

Intel Core i5-14500T

► remove from comparison

The Intel Core i5-14500T is a power-efficient desktop processor based on the Raptor Lake architecture, which was introduced in October 2022. The processor offers a base clock of 1.7 GHz and reaches up to 4.6 GHz in Turbo. The hybrid CPU architecture, which was introduced with Alder Lake, also benefits the Raptor Lake processors. The suffix T stands for a particularly economical CPU model and with a TDP of just 35 watts (PL1 = 35 watts), these processors are ideally suited to small, compact systems.

Performance

The low power consumption ultimately results in slightly lower performance compared to the Intel Core i5-14500. Depending on how the PL2 (92 watts) is defined, there may be noticeable differences in multi-core performance. Compared to the Intel Core i5-12500T, the Intel Core i5-14500T is superior due to the higher number of physical computing units. Compared to the Intel Core i5-13500T, there is no noticeable increase in performance due to the same number of computing units.

Graphics unit

Like the Intel Core i5-13500T, the Intel Core i5-14500T offers an integrated graphics unit. The Intel Iris Xe architecture continues to serve as the basis. In terms of performance, however, not much has changed with the new Intel UHD Graphics 770. The iGPU of the Intel Core i5-14500T also clocks 100 MHz higher, but this does not make a noticeable difference in everyday use.

Power consumption

The TDP of the Intel Core i5-14500T is 35 watts, with the option to increase this to up to 92 watts in Turbo mode. Compared to the Intel Core i5-13500T, nothing has changed in terms of power consumption.

ModelIntel Core i7-14700Intel Core i9-14900Intel Core i5-14500T
CodenameRaptor LakeRaptor LakeRaptor Lake
SeriesIntel Raptor Lake-RIntel Raptor Lake-RIntel Raptor Lake-R
Series: Raptor Lake-R Raptor Lake
Intel Core i9-14900K3.2 - 6 GHz24 / 32 cores36 MB L3
Intel Core i7-14700K2.5 - 5.6 GHz20 / 28 cores33 MB L3
Intel Core i9-149002 - 5.8 GHz24 / 32 cores36 MB L3
Intel Core i7-14700 « 1.5 - 5.4 GHz20 / 28 cores33 MB L3
Intel Core i5-14600K3.5 - 5.3 GHz14 / 20 cores24 MB L3
Intel Core i5-145002.6 - 5 GHz14 / 20 cores24 MB L3
Intel Core i5-14500T1.7 - 4.8 GHz14 / 20 cores24 MB L3
Intel Core i9-14900K3.2 - 6 GHz24 / 32 cores36 MB L3
Intel Core i7-14700K2.5 - 5.6 GHz20 / 28 cores33 MB L3
Intel Core i9-14900 « 2 - 5.8 GHz24 / 32 cores36 MB L3
Intel Core i7-147001.5 - 5.4 GHz20 / 28 cores33 MB L3
Intel Core i5-14600K3.5 - 5.3 GHz14 / 20 cores24 MB L3
Intel Core i5-145002.6 - 5 GHz14 / 20 cores24 MB L3
Intel Core i5-14500T1.7 - 4.8 GHz14 / 20 cores24 MB L3
Intel Core i9-14900K3.2 - 6 GHz24 / 32 cores36 MB L3
Intel Core i7-14700K2.5 - 5.6 GHz20 / 28 cores33 MB L3
Intel Core i9-149002 - 5.8 GHz24 / 32 cores36 MB L3
Intel Core i7-147001.5 - 5.4 GHz20 / 28 cores33 MB L3
Intel Core i5-14600K3.5 - 5.3 GHz14 / 20 cores24 MB L3
Intel Core i5-145002.6 - 5 GHz14 / 20 cores24 MB L3
Intel Core i5-14500T « 1.7 - 4.8 GHz14 / 20 cores24 MB L3
Clock1500 - 5400 MHz2000 - 5800 MHz1700 - 4800 MHz
L2 Cache28 MB32 MB11.5 MB
L3 Cache33 MB36 MB24 MB
Cores / Threads20 / 28
8 x 5.4 GHz Intel Raptor Cove P-Core
12 x 4.2 GHz Intel Gracemont E-Core
24 / 32
8 x 5.8 GHz Intel Raptor Cove P-Core
16 x 4.3 GHz Intel Gracemont E-Core
14 / 20
6 x 4.8 GHz Intel Golden Cove P-Core
8 x 3.4 GHz Intel Gracemont E-Core
TDP65 Watt65 Watt35 Watt
TDP Turbo PL2219 Watt219 Watt92 Watt
Technology10 nm10 nm10 nm
max. Temp.100 °C100 °C100 °C
SocketLGA 1700LGA 1700LGA 1700
FeaturesIntel UHD Graphics 770, max. 192 GB of DDR5 5600 MT/s or DDR4 3200 MT/sIntel UHD Graphics 770, DDR5 4800 MT/s, DDR4 3200 MT/s
iGPUIntel UHD Graphics 770 (300 - 1600 MHz)Intel UHD Graphics 770 (300 - 1650 MHz)Intel UHD Graphics 770 (300 - 1550 MHz)
Architecturex86x86x86
$384 U.S.$549 U.S.$232 U.S.
Announced
Manufacturerwww.intel.comwww.intel.dewww.intel.de
Die Size257 mm2215 mm2

Benchmarks

Performance Rating - CB R15 + R20 + 7-Zip + X265 + Blender + 3DM11 CPU - i7-14700
44.9 pt (75%)
Restrict / Search: Model: Max. age: years
Performance Rating - CB R15 + R20 + 7-Zip + X265 + Blender + 3DM11 CPU - i9-14900
47.2 pt (79%)
Restrict / Search: Model: Max. age: years
Performance Rating - CB R15 + R20 + 7-Zip + X265 + Blender + 3DM11 CPU - i5-14500T
37.9 pt (63%)
Restrict / Search: Model: Max. age: years
Cinebench 2024 - Cinebench 2024 CPU Single Core
123.4 Points (69%)
129 Points (72%)
103 Points (58%)
Cinebench 2024 - Cinebench 2024 CPU Multi Core
1243 Points (23%)
1245 Points (23%)
630 Points (12%)
Cinebench R23 - Cinebench R23 Multi Core
28398 Points (26%)
31070 Points (29%)
11790 Points (11%)
Cinebench R23 - Cinebench R23 Single Core
2080 Points (88%)
2212 Points (94%)
1838 Points (78%)
Cinebench R20 - Cinebench R20 CPU (Single Core)
798 Points (88%)
846 Points (94%)
706 Points (78%)
Cinebench R20 - Cinebench R20 CPU (Multi Core)
10501 Points (26%)
11291 Points (28%)
4319 Points (11%)
Cinebench R15 - Cinebench R15 CPU Multi 64 Bit
4061 Points (26%)
4793 Points (30%)
2022 Points (13%)
Cinebench R15 - Cinebench R15 CPU Single 64 Bit
299 Points (84%)
315 Points (88%)
252 Points (71%)
Cinebench R11.5 - Cinebench R11.5 CPU Multi 64 Bit
56.6 Points (73%)
21.6 Points (28%)
Cinebench R11.5 - Cinebench R11.5 CPU Single 64 Bit
3.8 Points (90%)
3.2 Points (76%)
Cinebench R10 - Cinebench R10 Rend. Single (32bit)
12284 Points (74%)
9014 Points (54%)
Cinebench R10 - Cinebench R10 Rend. Multi (32bit)
82492 Points (60%)
39798 Points (29%)
Cinebench R10 - Cinebench R10 Rend. Multi (64bit)
121768 Points (78%)
63443 Points (41%)
Cinebench R10 - Cinebench R10 Rend. Single (64bit)
17590 Points (21%)
14402 Points (18%)
wPrime 2.10 - wPrime 2.0 1024m *
85.6 s (1%)
221.3 s (3%)
wPrime 2.10 - wPrime 2.0 32m *
2.4 s (0%)
4.8 s (1%)
WinRAR - WinRAR 4.0
12359 Points (20%)
6846 Points (11%)
7-Zip 18.03 - 7-Zip 18.03 Multi Thread 4 runs
102982 MIPS (59%)
101652 MIPS (58%)
45820 MIPS (26%)
7-Zip 18.03 - 7-Zip 18.03 Single Thread 4 runs
6845 MIPS (81%)
7276 MIPS (86%)
5980 MIPS (70%)
X264 HD Benchmark 4.0 - x264 Pass 2
222 fps (74%)
108.1 fps (36%)
X264 HD Benchmark 4.0 - x264 Pass 1
358.5 fps (83%)
264.5 fps (61%)
HWBOT x265 Benchmark v2.2 - HWBOT x265 4k Preset
27.4 fps (48%)
31.6 fps (56%)
12.7 fps (22%)
TrueCrypt - TrueCrypt Serpent
2.4 GB/s (71%)
1 GB/s (30%)
TrueCrypt - TrueCrypt Twofish
4.9 GB/s (84%)
1.9 GB/s (33%)
TrueCrypt - TrueCrypt AES
18.5 GB/s (48%)
9.8 GB/s (26%)
Blender - Blender 3.3 Classroom CPU *
214 Seconds (3%)
263 Seconds (3%)
513 Seconds (7%)
Blender - Blender 2.79 BMW27 CPU *
123 Seconds (1%)
131 Seconds (1%)
288 Seconds (2%)
R Benchmark 2.5 - R Benchmark 2.5 *
0.4 sec (8%)
0.4 sec (8%)
0.4 sec (10%)
3DMark 06 - CPU - 3DMark 06 - CPU
18728 Points (40%)
12986 Points (28%)
Super Pi mod 1.5 XS 1M - Super Pi mod 1.5 XS 1M *
5.8 s (1%)
7.7 s (2%)
Super Pi mod 1.5 XS 2M - Super Pi mod 1.5 XS 2M *
12.6 s (1%)
17.1 s (1%)
Super Pi Mod 1.5 XS 32M - Super Pi mod 1.5 XS 32M *
303.4 s (1%)
408.8 s (2%)
3DMark Vantage - 3DM Vant. Perf. CPU no Physx
93183 Points (72%)
54226 Points (42%)
3DMark 11 - 3DM11 Performance Physics
24176 Points (60%)
28622 Points (71%)
15309 Points (38%)
3DMark - 3DMark Ice Storm Physics
88787 Points (72%)
73013 Points (59%)
3DMark - 3DMark Ice Storm Extreme Physics
90442 Points (73%)
72147 Points (59%)
3DMark - 3DMark Ice Storm Unlimited Physics
93001 Points (77%)
79337 Points (66%)
3DMark - 3DMark Cloud Gate Physics
22853 Points (58%)
20179 Points (51%)
14441 Points (37%)
3DMark - 3DMark Fire Strike Standard Physics
36871 Points (66%)
42316 Points (75%)
20354 Points (36%)
3DMark - 3DMark Time Spy CPU
14506 Points (61%)
19492 Points (82%)
8496 Points (36%)
Geekbench 6.4 - Geekbench 6.4 Single-Core
2876 Points (72%)
3022 Points (75%)
2546 Points (64%)
Geekbench 6.4 - Geekbench 6.4 Multi-Core
14072 Points (55%)
15962 Points (62%)
9225 Points (36%)
Geekbench 6.0 - Geekbench 6.0 Single-Core
3105 Points (99%)
2409 Points (76%)
Geekbench 6.0 - Geekbench 6.0 Multi-Core
21003 Points (86%)
8952 Points (37%)
Geekbench 5.5 - Geekbench 5.1 - 5.5 64 Bit Single-Core
2057 Points (80%)
2140 Points (84%)
1838 Points (72%)
Geekbench 5.5 - Geekbench 5.1 - 5.5 64 Bit Multi-Core
15052 Points (27%)
17395 Points (31%)
9122 Points (16%)
Geekbench 5.0 - Geekbench 5.0 64 Bit Single-Core
2077 Points (9%)
1782 Points (8%)
Geekbench 5.0 - Geekbench 5.0 64 Bit Multi-Core
17218 Points (54%)
8987 Points (28%)
Geekbench 4.4 - Geekbench 4.1 - 4.4 64 Bit Single-Core
9143 Points (91%)
7611 Points (76%)
Geekbench 4.4 - Geekbench 4.1 - 4.4 64 Bit Multi-Core
67178 Points (67%)
33122 Points (33%)
Mozilla Kraken 1.1 - Kraken 1.1 Total Score *
454 ms (1%)
436 ms (1%)
554 ms (1%)
WebXPRT 4 - WebXPRT 4 Score
300 Points (82%)
244 Points (67%)
WebXPRT 3 - WebXPRT 3 Score
350 Points (63%)
315 Points (57%)
262 Points (47%)
CrossMark - CrossMark Overall
2048 Points (77%)
2133 Points (80%)
1493 Points (56%)
Power Consumption - Prime95 Power Consumption - external Monitor *
213 Watt (37%)
145.5 Watt (25%)
59.1 Watt (10%)
Power Consumption - Cinebench R15 Multi Power Consumption - external Monitor *
199.6 Watt (36%)
253 Watt (46%)
79.8 Watt (15%)
Power Consumption - Idle Power Consumption - external Monitor *
35.3 Watt (23%)
29.9 Watt (20%)
8 Watt (5%)
Power Consumption - Power Efficiency - Cinebench R15 Multi external Monitor
20.3 Points per Watt (15%)
18.9 Points per Watt (14%)
25.3 Points per Watt (19%)

Average Benchmarks Intel Core i7-14700 → 100% n=25

Average Benchmarks Intel Core i9-14900 → 106% n=25

Average Benchmarks Intel Core i5-14500T → 66% n=25

- Range of benchmark values for this graphics card
red legend - Average benchmark values for this graphics card
* Smaller numbers mean a higher performance
1 This benchmark is not used for the average calculation

v1.33
log 26. 12:44:56

#0 ran 0s before starting gpusingle class +0s ... 0s

#1 checking url part for id 18635 +0s ... 0s

#2 checking url part for id 18150 +0s ... 0s

#3 checking url part for id 18026 +0s ... 0s

#4 not redirecting to Ajax server +0s ... 0s

#5 did not recreate cache, as it is less than 5 days old! Created at Fri, 25 Apr 2025 05:16:04 +0200 +0s ... 0s

#6 composed specs +0.005s ... 0.005s

#7 did output specs +0s ... 0.005s

#8 getting avg benchmarks for device 18635 +0.004s ... 0.009s

#9 got single benchmarks 18635 +0.005s ... 0.014s

#10 getting avg benchmarks for device 18150 +0.003s ... 0.017s

#11 got single benchmarks 18150 +0.005s ... 0.022s

#12 getting avg benchmarks for device 18026 +0.004s ... 0.026s

#13 got single benchmarks 18026 +0.004s ... 0.03s

#14 got avg benchmarks for devices +0s ... 0.03s

#15 min, max, avg, median took s +0.061s ... 0.091s

#16 return log +0s ... 0.091s

Please share our article, every link counts!
Mail Logo
> Expert Reviews and News on Laptops, Smartphones and Tech Innovations > Benchmarks / Tech > Processor Comparison - Head 2 Head
Redaktion, 2017-09- 8 (Update: 2023-07- 1)