Notebookcheck Logo

Intel Core i7-13700K vs Intel Core i5-13500 vs Intel Core i5-13500T

Intel Core i7-13700K

► remove from comparison Intel i7-13700K

The Intel Core i7-13700K is a high-end CPU based on the current Raptor Lake architecture, which was introduced in September 2022. The base clock is 3.4 GHz and can reach up to 5.4 GHz under optimal conditions. The total of 16 cores are divided into 8 P-cores and 8 E-cores, which we already know from the Alder Lake architecture. Compared to the Intel Core i7-12700K, however, the number of E-cores has been doubled, meaning that the Intel Core i7-13700K now offers 24 threads. As usual, the K models continue to offer a freely selectable multiplier, which simplifies overclocking. In addition, all new Raptor Lake processors can be operated on the existing Socket 1700 motherboards.

Performance

Compared to the Intel Core i7-12700K, the Core i7-13700K still offers 8 P-cores, but these are to be relieved by 8 additional E-cores for demanding applications. The E-cores primarily take care of background applications. The hybrid architecture relies on the Intel Thread Director, which is responsible for the correct allocation of tasks. Compared to Alder Lake, the number of e-cores has been doubled, which significantly improves multi-thread performance in combination with a further increase in IPC. If all requirements are met, Intel Turbo Boost 3.0 can increase the clock rate of the P-cores to up to 5.4 GHz. The E-cores can also be overclocked and reach a maximum of 3.4 GHz.

Graphics

Like the Intel Core i7-12700K, the Intel Core i7-13700K offers an integrated graphics unit (iGPU). The Intel Iris Xe architecture continues to serve as the basis. In terms of performance, however, not much has changed with the new Intel UHD Graphics 770.

Power Consumption

The Intel Core i7-13700K is specified with a TDP of 125 watts, which corresponds to the PL1 value. In Boost mode, the processor's performance can increase to up to 253 watts (PL2). However, this requires good cooling. If all restrictions are deactivated in the BIOS, the PL2 value is not restricted by a Tau value.

Intel Core i5-13500

► remove from comparison Intel i5-13500

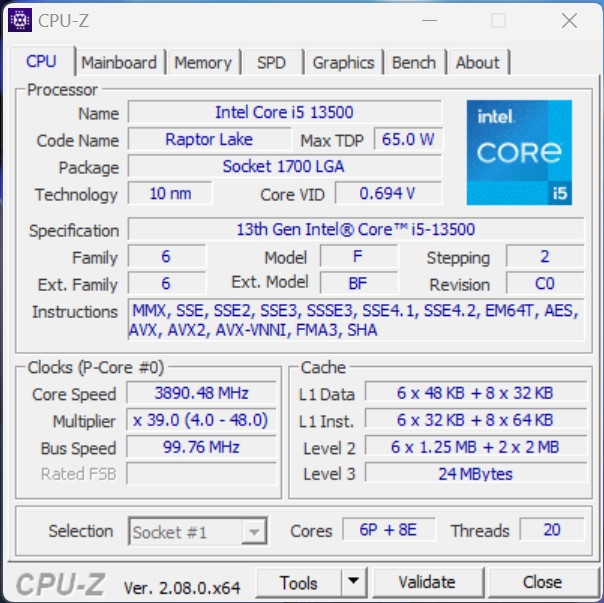
The Intel Core i5-13500 is a fast and relatively power efficient desktop processor based on the Raptor Lake architecture, which was introduced in October 2022. The processor offers a base clock of 2.5 GHz and reaches up to 4.8 GHz in Turbo. The hybrid CPU architecture introduced with Alder Lake is also used in the Raptor Lake processors. Compared to the Intel Core i5-12500, the Intel Core i5-13500 offers more cores, which means a higher overall performance can be achieved. In total, the Intel Core i5-13500 can process up to 20 threads in parallel. The performance cores (P cores) offer hyperthreading for this purpose, which is withheld from the energy-efficient cores (E cores).

Performance

Due to the higher number of physical computing units, the Intel Core i5-13500 offers noticeably more performance compared to the Intel Core i5-12500. Both processors have 6 P-cores, although only the Intel Core i5-13500 is additionally equipped with 8 E-cores.

Graphics unit

Like the Intel Core i5-12600K, the Intel Core i5-13500 offers an integrated graphics unit. The Intel Iris Xe architecture continues to serve as the basis. In terms of performance, however, not much has changed with the new Intel UHD Graphics 770.

Power consumption

The TDP of the Intel Core i5-13500 is 65 watts, with the option to increase this to up to 154 watts in Turbo mode. Compared to the Intel Core i5-12500, the energy requirement increases slightly.

Intel Core i5-13500T

► remove from comparison

The Intel Core i5-13500T is a fast and very economical desktop processor based on the Raptor Lake architecture, which was introduced in October 2022. The processor offers a base clock of 1.6 GHz and reaches up to 4.6 GHz in Turbo. The hybrid CPU architecture, which was introduced with Alder Lake, also benefits the Raptor Lake processors. The suffix T stands for a particularly economical CPU model, and with a TDP of just 35 watts (PL1 = 35 watts), these processors are ideally suited for small, compact systems.

Performance

The low power consumption ultimately results in slightly lower performance compared to the Intel Core i5-13500. Depending on how the PL2 (92 watts) is defined, there may be noticeable differences in multi-core performance. Compared to the Intel Core i5-12500T, the Intel Core i5-13500T is superior due to the higher number of physical computing units.

Graphics unit

Like the Intel Core i5-12500T, the Intel Core i5-13500T offers an integrated graphics unit. The Intel Iris Xe architecture continues to serve as the basis. In terms of performance, however, not much has changed with the new Intel UHD Graphics 770. The iGPU of the Intel Core i5-13500T also clocks 100 MHz higher, but this does not make a noticeable difference in everyday use.

Power consumption

The TDP of the Intel Core i5-13500T is 35 watts, with the option to increase this to up to 92 watts in Turbo mode. Compared to the Intel Core i5-12500T (PL2 = 74 watts), the maximum possible energy requirement increases slightly.

ModelIntel Core i7-13700KIntel Core i5-13500Intel Core i5-13500T
CodenameRaptor LakeRaptor LakeRaptor Lake
SeriesIntel Raptor Lake-SIntel Raptor Lake-SIntel Raptor Lake-S
Series: Raptor Lake-S Raptor Lake
Intel Core i9-13900K3 - 5.8 GHz24 / 32 cores36 MB L3
Intel Core i7-13700K « 3.4 - 5.4 GHz16 / 24 cores30 MB L3
Intel Core i5-13600K3.5 - 5.1 GHz14 / 20 cores24 MB L3
Intel Core i5-135002.5 - 4.8 GHz14 / 20 cores24 MB L3
Intel Core i5-13500T1.6 - 4.6 GHz14 / 20 cores24 MB L3
Intel Core i9-13900K3 - 5.8 GHz24 / 32 cores36 MB L3
Intel Core i7-13700K3.4 - 5.4 GHz16 / 24 cores30 MB L3
Intel Core i5-13600K3.5 - 5.1 GHz14 / 20 cores24 MB L3
Intel Core i5-13500 « 2.5 - 4.8 GHz14 / 20 cores24 MB L3
Intel Core i5-13500T1.6 - 4.6 GHz14 / 20 cores24 MB L3
Intel Core i9-13900K3 - 5.8 GHz24 / 32 cores36 MB L3
Intel Core i7-13700K3.4 - 5.4 GHz16 / 24 cores30 MB L3
Intel Core i5-13600K3.5 - 5.1 GHz14 / 20 cores24 MB L3
Intel Core i5-135002.5 - 4.8 GHz14 / 20 cores24 MB L3
Intel Core i5-13500T « 1.6 - 4.6 GHz14 / 20 cores24 MB L3
Clock3400 - 5400 MHz2500 - 4800 MHz1600 - 4600 MHz
L2 Cache24 MB11.5 MB11.5 MB
L3 Cache30 MB24 MB24 MB
Cores / Threads16 / 24
8 x 5.4 GHz Intel Raptor Cove P-Core
8 x 3.4 GHz Intel Gracemont E-Core
14 / 20
6 x 4.8 GHz Intel Raptor Cove P-Core
8 x 3.5 GHz Intel Gracemont E-Core
14 / 20
6 x 4.6 GHz Intel Golden Cove P-Core
8 x 3.2 GHz Intel Gracemont E-Core
TDP125 Watt65 Watt35 Watt
Technology10 nm10 nm10 nm
Die Size257 mm2215 mm2215 mm2
max. Temp.100 °C100 °C100 °C
SocketLGA 1700LGA 1700LGA 1700
FeaturesIntel UHD Graphics 770, DDR5 5600 MT/s, DDR4 3200 MT/sIntel UHD Graphics 770, DDR5 4800 MT/s, DDR4 3200 MT/sIntel UHD Graphics 770, DDR5 4800 MT/s, DDR4 3200 MT/s
iGPUIntel UHD Graphics 770 (300 - 1600 MHz)Intel UHD Graphics 770 (300 - 1550 MHz)Intel UHD Graphics 770 (300 - 1550 MHz)
Architecturex86x86x86
$409 U.S.
Announced
Manufacturerwww.intel.dewww.intel.de
TDP Turbo PL2154 Watt92 Watt

Benchmarks

Performance Rating - CB R15 + R20 + 7-Zip + X265 + Blender + 3DM11 CPU - i7-13700K
46.1 pt (77%)
Restrict / Search: Model: Max. age: years
Performance Rating - CB R15 + R20 + 7-Zip + X265 + Blender + 3DM11 CPU - i5-13500
38.3 pt (64%)
Restrict / Search: Model: Max. age: years
Performance Rating - CB R15 + R20 + 7-Zip + X265 + Blender + 3DM11 CPU - i5-13500T
37 pt (62%)
Restrict / Search: Model: Max. age: years
Cinebench 2024 - Cinebench 2024 CPU Single Core
107 Points (60%)
104 Points (58%)
Cinebench 2024 - Cinebench 2024 CPU Multi Core
822 Points (15%)
577 Points (11%)
Cinebench R23 - Cinebench R23 Multi Core
min: 30737     avg: 30745     median: 30745 (29%)     max: 30753 Points
14573 Points (14%)
11028 Points (10%)
Cinebench R23 - Cinebench R23 Single Core
min: 2114     avg: 2116     median: 2116 (90%)     max: 2118 Points
1780 Points (76%)
1754 Points (75%)
Cinebench R20 - Cinebench R20 CPU (Single Core)
min: 808     avg: 812     median: 811.5 (90%)     max: 815 Points
685 Points (76%)
669 Points (74%)
Cinebench R20 - Cinebench R20 CPU (Multi Core)
min: 11685     avg: 11714     median: 11713.5 (29%)     max: 11742 Points
5633 Points (14%)
4246 Points (10%)
Cinebench R15 - Cinebench R15 CPU Multi 64 Bit
min: 4438     avg: 4508     median: 4507.5 (28%)     max: 4577 Points
2405 Points (15%)
1945 Points (12%)
Cinebench R15 - Cinebench R15 CPU Single 64 Bit
303 Points (85%)
256 Points (72%)
247 Points (69%)
Cinebench R11.5 - Cinebench R11.5 CPU Multi 64 Bit
53 Points (69%)
28.4 Points (37%)
21.3 Points (28%)
Cinebench R11.5 - Cinebench R11.5 CPU Single 64 Bit
3.7 Points (87%)
3.1 Points (74%)
3.1 Points (72%)
Cinebench R10 - Cinebench R10 Rend. Single (32bit)
11278 Points (68%)
8875 Points (54%)
8693 Points (53%)
Cinebench R10 - Cinebench R10 Rend. Multi (32bit)
85748 Points (62%)
49300 Points (36%)
40528 Points (29%)
Cinebench R10 - Cinebench R10 Rend. Multi (64bit)
135499 Points (87%)
79625 Points (51%)
62808 Points (40%)
Cinebench R10 - Cinebench R10 Rend. Single (64bit)
17002 Points (21%)
14282 Points (17%)
14147 Points (17%)
wPrime 2.10 - wPrime 2.0 1024m *
170.2 s (2%)
100.7 s (1%)
133.3 s (2%)
wPrime 2.10 - wPrime 2.0 32m *
2.3 s (0%)
4 s (1%)
4.8 s (1%)
WinRAR - WinRAR 4.0
12835 Points (20%)
7704 Points (12%)
6683 Points (11%)
7-Zip 18.03 - 7-Zip 18.03 Multi Thread 4 runs
min: 110420     avg: 111390     median: 111390 (64%)     max: 112359 MIPS
55528 MIPS (32%)
40034 MIPS (23%)
7-Zip 18.03 - 7-Zip 18.03 Single Thread 4 runs
min: 7061     avg: 7062     median: 7061.5 (83%)     max: 7062 MIPS
5887 MIPS (69%)
5840 MIPS (69%)
X264 HD Benchmark 4.0 - x264 Pass 2
232 fps (78%)
134.6 fps (45%)
100.5 fps (34%)
X264 HD Benchmark 4.0 - x264 Pass 1
406 fps (94%)
306 fps (71%)
259.5 fps (60%)
HWBOT x265 Benchmark v2.2 - HWBOT x265 4k Preset
min: 33.7     avg: 33.9     median: 33.9 (59%)     max: 34 fps
16.3 fps (29%)
12.1 fps (21%)
TrueCrypt - TrueCrypt Serpent
2.2 GB/s (65%)
1.3 GB/s (38%)
1 GB/s (29%)
TrueCrypt - TrueCrypt Twofish
4 GB/s (69%)
2.3 GB/s (40%)
1.8 GB/s (31%)
TrueCrypt - TrueCrypt AES
15.8 GB/s (41%)
12 GB/s (31%)
8.2 GB/s (21%)
Blender - Blender 3.3 Classroom CPU *
min: 174     avg: 176.5     median: 176.5 (2%)     max: 179 Seconds
399 Seconds (5%)
533 Seconds (7%)
Blender - Blender 2.79 BMW27 CPU *
min: 106     avg: 108     median: 108 (1%)     max: 110 Seconds
223 Seconds (2%)
291 Seconds (2%)
R Benchmark 2.5 - R Benchmark 2.5 *
min: 0.3855     avg: 0.4     median: 0.4 (8%)     max: 0.3899 sec
0.4 sec (10%)
0.5 sec (10%)
3DMark 06 - CPU - 3DMark 06 - CPU
18153 Points (39%)
14875 Points (32%)
12818 Points (27%)
Super Pi mod 1.5 XS 1M - Super Pi mod 1.5 XS 1M *
6.2 s (1%)
7.8 s (2%)
8 s (2%)
Super Pi mod 1.5 XS 2M - Super Pi mod 1.5 XS 2M *
13.2 s (1%)
17.2 s (1%)
17.9 s (1%)
Super Pi Mod 1.5 XS 32M - Super Pi mod 1.5 XS 32M *
317.8 s (1%)
430.1 s (2%)
3DMark Vantage - 3DM Vant. Perf. CPU no Physx
85363 Points (66%)
69725 Points (54%)
54029 Points (42%)
3DMark 11 - 3DM11 Performance Physics
31214 Points (78%)
18026 Points (45%)
12162 Points (30%)
3DMark - 3DMark Ice Storm Physics
99898 Points (81%)
84456 Points (69%)
70975 Points (58%)
3DMark - 3DMark Ice Storm Extreme Physics
99878 Points (81%)
83392 Points (68%)
69547 Points (56%)
3DMark - 3DMark Ice Storm Unlimited Physics
103719 Points (86%)
81778 Points (68%)
77848 Points (65%)
3DMark - 3DMark Cloud Gate Physics
28204 Points (71%)
17891 Points (45%)
13665 Points (35%)
3DMark - 3DMark Fire Strike Standard Physics
45127 Points (80%)
26263 Points (47%)
18673 Points (33%)
3DMark - 3DMark Time Spy CPU
18897 Points (80%)
9655 Points (41%)
6210 Points (26%)
Geekbench 6.4 - Geekbench 6.4 Single-Core
2962 Points (74%)
2483 Points (62%)
2393 Points (60%)
Geekbench 6.4 - Geekbench 6.4 Multi-Core
19249 Points (75%)
10348 Points (40%)
7327 Points (28%)
Geekbench 6.0 - Geekbench 6.0 Single-Core
3105 Points (99%)
3105 Points (99%)
Geekbench 6.0 - Geekbench 6.0 Multi-Core
21003 Points (86%)
21003 Points (86%)
Geekbench 5.5 - Geekbench 5.1 - 5.5 64 Bit Single-Core
min: 2081     avg: 2110     median: 2110 (82%)     max: 2139 Points
1805 Points (71%)
1716 Points (67%)
Geekbench 5.5 - Geekbench 5.1 - 5.5 64 Bit Multi-Core
min: 19719     avg: 20191     median: 20190.5 (36%)     max: 20662 Points
10322 Points (18%)
7377 Points (13%)
Geekbench 5.0 - Geekbench 5.0 64 Bit Single-Core
2064 Points (9%)
1749 Points (8%)
1685 Points (7%)
Geekbench 5.0 - Geekbench 5.0 64 Bit Multi-Core
19217 Points (61%)
10213 Points (32%)
7316 Points (23%)
Geekbench 4.4 - Geekbench 4.1 - 4.4 64 Bit Single-Core
8955 Points (89%)
7379 Points (74%)
7069 Points (71%)
Geekbench 4.4 - Geekbench 4.1 - 4.4 64 Bit Multi-Core
69210 Points (69%)
39094 Points (39%)
29164 Points (29%)
Mozilla Kraken 1.1 - Kraken 1.1 Total Score *
min: 444     avg: 445.7     median: 444 (1%)     max: 449 ms
519 ms (1%)
562 ms (1%)
WebXPRT 4 - WebXPRT 4 Score
301 Points (83%)
254 Points (70%)
WebXPRT 3 - WebXPRT 3 Score
348 Points (62%)
266 Points (48%)
254 Points (46%)
CrossMark - CrossMark Overall
2325 Points (87%)
1549 Points (58%)
1324 Points (50%)
Power Consumption - Prime95 Power Consumption - external Monitor *
357 Watt (62%)
98.7 Watt (17%)
55.6 Watt (10%)
Power Consumption - Cinebench R15 Multi Power Consumption - external Monitor *
357 Watt (65%)
121 Watt (22%)
79.3 Watt (14%)
Power Consumption - Idle Power Consumption - external Monitor *
83.7 Watt (55%)
1058%
1 i5-13500 +
7.9 Watt (5%)
8.6 Watt (6%)
Power Consumption - Power Efficiency - Cinebench R15 Multi external Monitor
19.9 Points per Watt (15%)
21.9 Points per Watt (16%)

Average Benchmarks Intel Core i7-13700K → 100% n=48

Average Benchmarks Intel Core i5-13500 → 70% n=48

Average Benchmarks Intel Core i5-13500T → 60% n=48

- Range of benchmark values for this graphics card
red legend - Average benchmark values for this graphics card
* Smaller numbers mean a higher performance
1 This benchmark is not used for the average calculation

v1.33
log 15. 22:45:40

#0 ran 0s before starting gpusingle class +0s ... 0s

#1 checking url part for id 14998 +0s ... 0s

#2 checking url part for id 17901 +0s ... 0s

#3 checking url part for id 17902 +0s ... 0s

#4 not redirecting to Ajax server +0s ... 0s

#5 did not recreate cache, as it is less than 5 days old! Created at Tue, 13 May 2025 05:18:04 +0200 +0s ... 0s

#6 composed specs +0.004s ... 0.004s

#7 did output specs +0s ... 0.004s

#8 getting avg benchmarks for device 14998 +0.004s ... 0.008s

#9 got single benchmarks 14998 +0.005s ... 0.014s

#10 getting avg benchmarks for device 17901 +0.004s ... 0.018s

#11 got single benchmarks 17901 +0.004s ... 0.022s

#12 getting avg benchmarks for device 17902 +0.004s ... 0.026s

#13 got single benchmarks 17902 +0.004s ... 0.03s

#14 got avg benchmarks for devices +0s ... 0.03s

#15 min, max, avg, median took s +0.08s ... 0.11s

#16 return log +0s ... 0.11s

Please share our article, every link counts!
Mail Logo
> Expert Reviews and News on Laptops, Smartphones and Tech Innovations > Benchmarks / Tech > Processor Comparison - Head 2 Head
Redaktion, 2017-09- 8 (Update: 2023-07- 1)