

Intel Core i7-11850H vs Intel Core i5-11500B vs Intel Xeon W-11855M
Intel Core i7-11850H
► remove from comparison
The Intel Core i7-11800H is a high end octa core SoC for gaming laptops and mobile workstations. It is based on the Tiger Lake H45 generation and will be announced in mid 2021. It integrates eight Willow Cove processor cores (16 threads thanks to HyperThreading). The base clock speed depends on the TDP setting and at 45 Watt is at 2.4 GHz. The single core boost speed can reach up to 4.6 GHz, all cores can reach up to 4.2 GHz. The CPU offers 24 MB level 3 cache and supports DDR4-3200 memory. Compared to the slower clocked i7-11800H, the 11850H offers professional management features like Intel vPro, SIPP or TXT.
Thanks to the new Tiger Lake architecture, the i9-11850H should be similar or faster than the old Intel Core i9-10875H (Comet Lake-H, 2.3 - 5.1 GHz, 16 MB L3) in single and multi threaded performance and similar to the Ryzen 9 5800H (Zen 3, 3.2 - 4.4 GHz, 16 MB L3). Therefore, the i7 is well suited for even very demanding tasks.
The SoC also includes the improved Xe graphics card called UHD graphics with all 32 EUs.
Furthermore, Tiger Lake SoCs add PCIe 4 support (20 lanes in the H45 series), AI hardware acceleration, and the partial integration of Thunderbolt 4/USB 4 and Wi-Fi 6E in the chip.
The chip is produced on the improved 10nm process (called 10nm SuperFin) at Intel, which should be comparable to the 7nm process at TSMC (e.g. Ryzen 4000 series). The default TDP is rated at 45 W at 2.4 GHz base speed, at 35 Watt the base clock speed decreases to 2 GHz (cTDP down).
All articles on Tiger Lake can be found on our Tiger Lake architecture hub.
Intel Core i5-11500B
► remove from comparison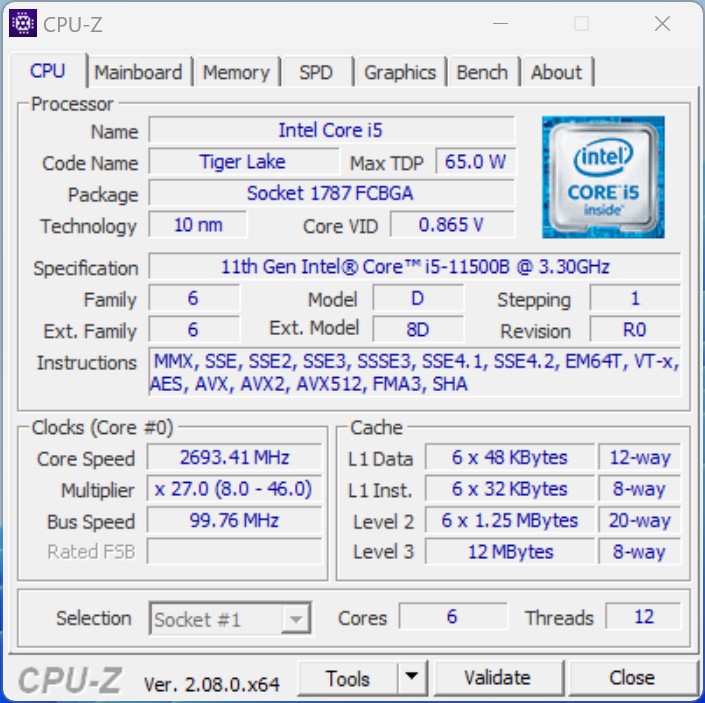
The Intel Core i5-11500B is a hexa-core processor for desktops and mini PCs. It is based on the Tiger Lake architecture (H45) and was presented in Q2 2021. The chip offers a TDP of 65 watts (configurable). The six processor cores can clock from 3.3 to 4.6 GHz (single-core turbo). The processor offers 12 MB level 3 cache and supports DDR4 RAM with up to 3,200 MT/s. The integrated graphics are based on the Xe architecture and are named UHD Graphics (32 EUs). In the 11500B it clocks from 350 to 1,450 MHz. The chip is manufactured using the 10 nm SuperFin process.
Performance
The performance of the Intel Core i5-11500B depends primarily on the performance of the installed cooling unit. The TDP of the SoC can also be lowered. In principle, however, the Intel Core i5-11500B should offer slightly more performance than an Intel Core i5-11400H (6 cores 2.7 - 4.5 GHz).
Features
As with the smaller Tiger Lake chips, Wi-Fi (Wi-Fi 6E) and Thunderbolt 4 / USB 4 are (partially) integrated into the chip for faster, cheaper and space-saving implementations in desktops and mini-PCs. The i5-11500B also offers 20 PCIe 4.0 lanes.
Intel Xeon W-11855M
► remove from comparisonThe Intel Xeon W-11855M is a high end hexa core SoC for laptops and mobile workstations. It is based on the Tiger Lake H45 generation and was announced in mid 2021. It integrates six Willow Cove processor cores (12 threads thanks to HyperThreading). The base clock speed depends on the TDP setting and at 45 Watt is at 3.2 GHz. The single and dual core boost speed can reach up to 4.9 GHz (using ITBM 3.0), all cores can reach up to 4.4 GHz. The CPU offers 18 MB level 3 cache and supports DDR4-3200 memory.
The Xeon W-11855M is the fastest 6-core CPU of the Tiger Lake line-up at launch and should easily best the older 6 core CPUs thanks to the high clock speeds and the new architecture. Therefore, the Xeon is well suited for even very demanding tasks and is only bested by the 8-core CPUs like the W-11955M.
The SoC also included the improved Xe graphics card called UHD graphics with all 32 EUs.
Furthermore, Tiger Lake SoCs add PCIe 4 support (20 lanes in the H45 series), AI hardware acceleration, and the partial integration of Thunderbolt 4/USB 4 and Wi-Fi 6E in the chip.
The chip is produced on the improved 10nm process (called 10nm SuperFin) at Intel, which should be comparable to the 7nm process at TSMC (e.g. Ryzen 4000 series). The default TDP is rated at 45 W at 3.2 GHz base speed, at 35 Watt the base clock speed decreases to 2.6 GHz (cTDP down).
All articles on Tiger Lake can be found on our Tiger Lake architecture hub.
| Model | Intel Core i7-11850H | Intel Core i5-11500B | Intel Xeon W-11855M | ||||||||||||||||||||||||||||||||||||||||||||||||||||||||||||||||||||||||||||||||||||||||||||||||||||||||||||||||||||||||
| Codename | Tiger Lake-H | Tiger Lake-H | Tiger Lake-H | ||||||||||||||||||||||||||||||||||||||||||||||||||||||||||||||||||||||||||||||||||||||||||||||||||||||||||||||||||||||||
| Series | Intel Tiger Lake | Intel Tiger Lake | Intel Tiger Lake | ||||||||||||||||||||||||||||||||||||||||||||||||||||||||||||||||||||||||||||||||||||||||||||||||||||||||||||||||||||||||
| Series: Tiger Lake Tiger Lake-H |
|
|
| ||||||||||||||||||||||||||||||||||||||||||||||||||||||||||||||||||||||||||||||||||||||||||||||||||||||||||||||||||||||||
| Clock | 2500 - 4800 MHz | 3300 - 4600 MHz | 3200 - 4900 MHz | ||||||||||||||||||||||||||||||||||||||||||||||||||||||||||||||||||||||||||||||||||||||||||||||||||||||||||||||||||||||||
| L1 Cache | 640 KB | 480 KB | 480 KB | ||||||||||||||||||||||||||||||||||||||||||||||||||||||||||||||||||||||||||||||||||||||||||||||||||||||||||||||||||||||||
| L2 Cache | 10 MB | 7.5 MB | 7.5 MB | ||||||||||||||||||||||||||||||||||||||||||||||||||||||||||||||||||||||||||||||||||||||||||||||||||||||||||||||||||||||||
| L3 Cache | 24 MB | 12 MB | 18 MB | ||||||||||||||||||||||||||||||||||||||||||||||||||||||||||||||||||||||||||||||||||||||||||||||||||||||||||||||||||||||||
| Cores / Threads | 8 / 16 | 6 / 12 | 6 / 12 | ||||||||||||||||||||||||||||||||||||||||||||||||||||||||||||||||||||||||||||||||||||||||||||||||||||||||||||||||||||||||
| TDP | 45 Watt | 65 Watt | 45 Watt | ||||||||||||||||||||||||||||||||||||||||||||||||||||||||||||||||||||||||||||||||||||||||||||||||||||||||||||||||||||||||
| Technology | 10 nm | 10 nm | 10 nm | ||||||||||||||||||||||||||||||||||||||||||||||||||||||||||||||||||||||||||||||||||||||||||||||||||||||||||||||||||||||||
| max. Temp. | 100 °C | 100 °C | 100 °C | ||||||||||||||||||||||||||||||||||||||||||||||||||||||||||||||||||||||||||||||||||||||||||||||||||||||||||||||||||||||||
| Socket | BGA1787 | BGA1787 | BGA1787 | ||||||||||||||||||||||||||||||||||||||||||||||||||||||||||||||||||||||||||||||||||||||||||||||||||||||||||||||||||||||||
| Features | DDR4-3200 RAM, PCIe 4, 8 GT/s bus, DL Boost, GNA, vPro, MMX, SSE, SSE2, SSE3, SSSE3, SSE4.1, SSE4.2, AVX, AVX2, AVX-512, BMI2, ABM, FMA, ADX, SMX, SMEP, SMAP, EIST, TM1, TM2, HT, Turbo, SST, AES-NI, RDRAND, RDSEED, SHA, TME | DDR4-3200 RAM, PCIe 4, 8 GT/s bus, DL Boost, GNA, MMX, SSE, SSE2, SSE3, SSSE3, SSE4.1, SSE4.2, AVX, AVX2, AVX-512, BMI2, ABM, FMA, ADX, VMX, SMEP, SMAP, EIST, TM1, TM2, HT, Turbo, SST, AES-NI, RDRAND, RDSEED, SHA | DDR4-3200 RAM (incl. ECC), PCIe 4, 8 GT/s bus, DL B., GNA, vPro, MMX, SSE, SSE2, SSE3, SSSE3, SSE4.1, SSE4.2, AVX, AVX2, AVX-512, BMI2, ABM, FMA, ADX, VMX, SMEP, SMAP, EIST, TM1, TM2, HT, Turbo, SST, AES-NI, RDRAND, RDSEED, SHA | ||||||||||||||||||||||||||||||||||||||||||||||||||||||||||||||||||||||||||||||||||||||||||||||||||||||||||||||||||||||||
| iGPU | Intel UHD Graphics Xe 32EUs (Tiger Lake-H) (350 - 1450 MHz) | Intel UHD Graphics Xe 32EUs (Tiger Lake-H) (350 - 1450 MHz) | Intel UHD Graphics Xe 32EUs (Tiger Lake-H) (350 - 1450 MHz) | ||||||||||||||||||||||||||||||||||||||||||||||||||||||||||||||||||||||||||||||||||||||||||||||||||||||||||||||||||||||||
| Architecture | x86 | x86 | x86 | ||||||||||||||||||||||||||||||||||||||||||||||||||||||||||||||||||||||||||||||||||||||||||||||||||||||||||||||||||||||||
| Announced | |||||||||||||||||||||||||||||||||||||||||||||||||||||||||||||||||||||||||||||||||||||||||||||||||||||||||||||||||||||||||||
| Manufacturer | ark.intel.com | ark.intel.com |

Benchmarks

Average Benchmarks Intel Core i7-11850H → 100% n=4
Average Benchmarks Intel Core i5-11500B → 89% n=4
Average Benchmarks Intel Xeon W-11855M → 93% n=4
* Smaller numbers mean a higher performance
1 This benchmark is not used for the average calculation