Notebookcheck Logo

Intel Core i5-14600K vs Intel Core i7-14700K vs Intel Core i9-14900

Intel Core i5-14600K

► remove from comparison Intel i5-14600K

The Intel Core i5-14600K is a modern desktop processor based on the Raptor Lake architecture, which inherits the 13th generation of Intel Core processors with minor improvements. The processor offers a base clock of 3.5 GHz and reaches up to 5.3 GHz in Turbo. The basic CPU structure remains unchanged. This means that the Intel Core i5-14600K also has 6 P-cores and 8 E-cores, which means that up to 20 threads can be processed in parallel. The Intel Core i5-14600K still offers a freely selectable multiplier, which makes overclocking much easier. The LGA 1700 socket, which was already introduced with Alder-Lake, is also used as the basis.

Performance

Compared to the Intel Core i5-13600K , the IPC of the new Core i5-14600K has only been increased slightly. This means that the difference in performance is also only slight. The hybrid architecture relies on the Intel Thread Director, which is responsible for the correct allocation of tasks. As a further innovation, the manufacturer is increasingly relying on AI, which is also used for overclocking. With one click in the Intel Extreme Utility, the tool checks the entire system and makes the necessary settings.

Graphics unit

Like the Intel Core i5-13600K, the Intel Core i5-14600K also has an integrated graphics unit. The Intel Iris Xe architecture continues to serve as the basis. In terms of performance, however, nothing has changed with the Intel UHD Graphics 770.

Power consumption

The TDP of the Intel Core i5-14600K is 125 watts, with the option of consuming up to 181 watts in Turbo mode. If all limits are removed, the energy requirement rises to up to 240 watts. For cooling, we recommend a powerful air cooler or a 240 AiO.

Intel Core i7-14700K

► remove from comparison Intel i7-14700K

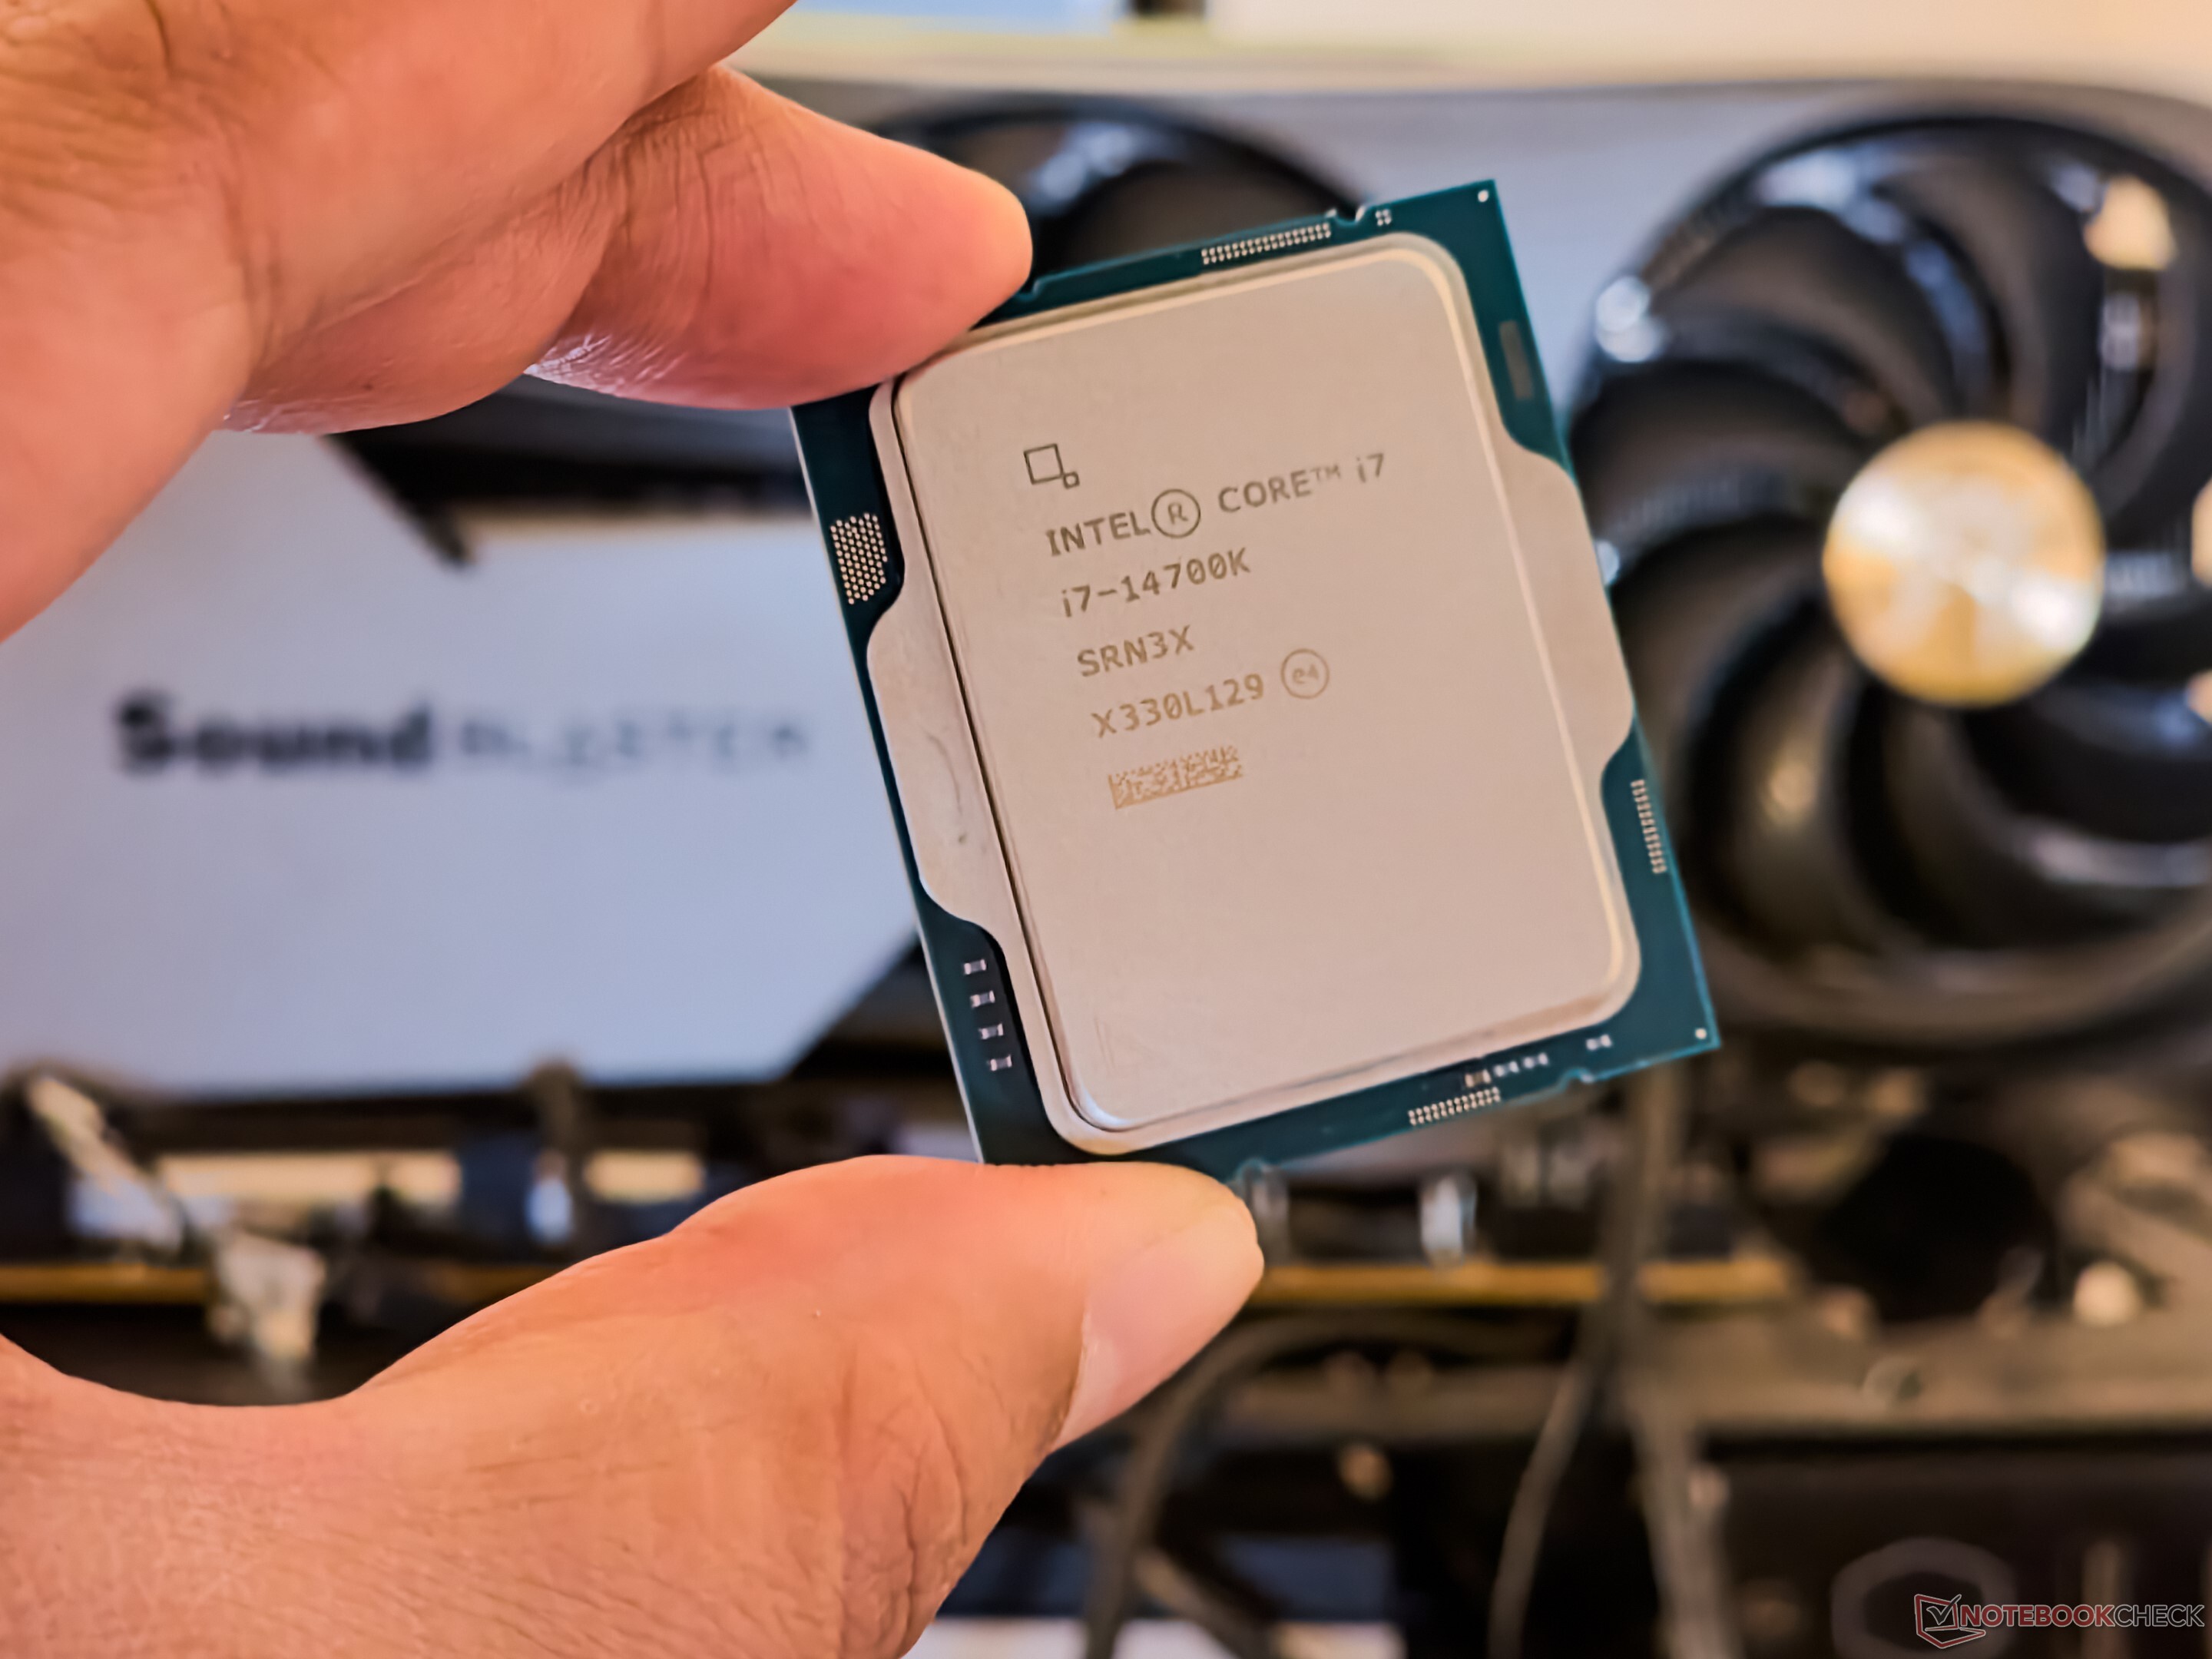
The Intel Core i7-14700K is a desktop processor based on the Raptor Lake architecture, which inherits the 13th generation of Intel Core processors with minor improvements. The processor offers a base clock of 2.5 GHz or 3.4 GHz and reaches up to 5.6 GHz in Turbo. The basic CPU structure remains unchanged. The Intel Core i7-14700K features 8 P-cores and 12 E-cores, allowing up to 28 threads to be processed in parallel. The Intel Core i7-14700K still offers a freely selectable multiplier, which makes overclocking much easier. It is also based on the LGA 1700 socket, which was already introduced with Alder Lake.

Performance

Compared to the Intel Core i7-13700K, the IPC of the new Core i7-14700K has only been increased slightly. This means that the difference in performance is only due to the higher number of efficiency cores (12 vs. 8) and higher clock rates.


Graphics unit

Like the Intel Core i7-13700K, the Intel Core i7-14700K also has an integrated graphics unit. The Intel Iris Xe architecture continues to serve as the basis. In terms of performance, however, nothing has changed with the Intel UHD Graphics 770.

Power consumption

The TDP of the Intel Core i7-14700K is 125 Watts, with the option of consuming up to 253 watts in Turbo mode.

Intel Core i9-14900

► remove from comparison Intel i9-14900

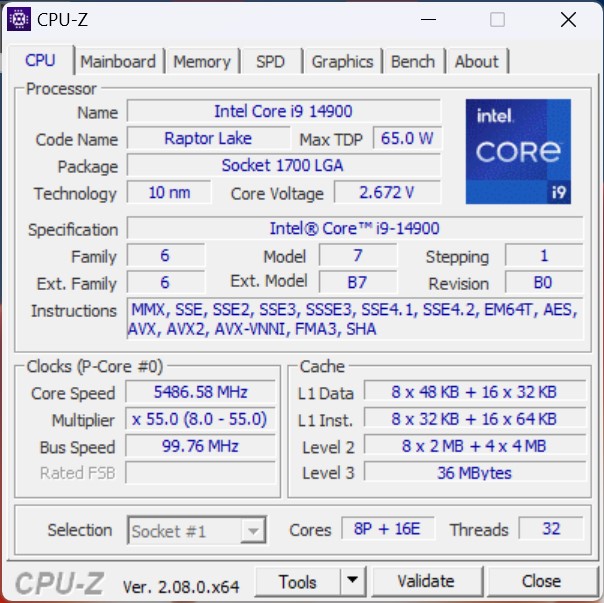
The Intel Core i9-14900 is a high-end processor based on the Raptor Lake architecture. The base clock is 2 GHz and can reach up to 5.8 GHz under optimal conditions. Similar to the top model (Intel Core i9-14900K), the total of 32 threads are divided into 8 p- and 16 e-cores. The 8 performance cores (p-cores) also offer hyperthreading, which means that a total of 32 threads can be processed simultaneously. The non-K model is an economical processor. There is still the option of DDR4 or DDR5 memory.

Performance

Compared to the Intel Core i9-14900K, the Core i9-14900 offers the same number of physical computing units. However, due to the lower power consumption, the Intel Core i9-14900 delivers slightly less performance. The intended use is primarily for compact PCs with limited cooling options.

Graphics unit

Like the Intel Core i9-14900K, the Intel Core i9-14900 offers an integrated graphics unit. The Intel Iris Xe architecture continues to serve as the basis. In terms of performance, however, nothing has changed with the Intel UHD Graphics 770.

Power consumption

The Intel Core i9-14900 is specified with a TDP of 65 watts, which corresponds to the PL1 value. In boost mode, the processor's performance can increase to up to 219 watts (PL2). However, this requires very good cooling. Compared to the Intel Core i9-13900, the specified power consumption has not changed.

ModelIntel Core i5-14600KIntel Core i7-14700KIntel Core i9-14900
CodenameRaptor LakeRaptor LakeRaptor Lake
SeriesIntel Raptor Lake-RIntel Raptor Lake-RIntel Raptor Lake-R
Series: Raptor Lake-R Raptor Lake
Intel Core i9-14900K3.2 - 6 GHz24 / 32 cores36 MB L3
Intel Core i7-14700K2.5 - 5.6 GHz20 / 28 cores33 MB L3
Intel Core i9-149002 - 5.8 GHz24 / 32 cores36 MB L3
Intel Core i7-147001.5 - 5.4 GHz20 / 28 cores33 MB L3
Intel Core i5-14600K « 3.5 - 5.3 GHz14 / 20 cores24 MB L3
Intel Core i5-145002.6 - 5 GHz14 / 20 cores24 MB L3
Intel Core i5-14500T1.7 - 4.8 GHz14 / 20 cores24 MB L3
Intel Core i9-14900K3.2 - 6 GHz24 / 32 cores36 MB L3
Intel Core i7-14700K « 2.5 - 5.6 GHz20 / 28 cores33 MB L3
Intel Core i9-149002 - 5.8 GHz24 / 32 cores36 MB L3
Intel Core i7-147001.5 - 5.4 GHz20 / 28 cores33 MB L3
Intel Core i5-14600K3.5 - 5.3 GHz14 / 20 cores24 MB L3
Intel Core i5-145002.6 - 5 GHz14 / 20 cores24 MB L3
Intel Core i5-14500T1.7 - 4.8 GHz14 / 20 cores24 MB L3
Intel Core i9-14900K3.2 - 6 GHz24 / 32 cores36 MB L3
Intel Core i7-14700K2.5 - 5.6 GHz20 / 28 cores33 MB L3
Intel Core i9-14900 « 2 - 5.8 GHz24 / 32 cores36 MB L3
Intel Core i7-147001.5 - 5.4 GHz20 / 28 cores33 MB L3
Intel Core i5-14600K3.5 - 5.3 GHz14 / 20 cores24 MB L3
Intel Core i5-145002.6 - 5 GHz14 / 20 cores24 MB L3
Intel Core i5-14500T1.7 - 4.8 GHz14 / 20 cores24 MB L3
Clock3500 - 5300 MHz2500 - 5600 MHz2000 - 5800 MHz
L2 Cache20 MB28 MB32 MB
L3 Cache24 MB33 MB36 MB
Cores / Threads14 / 20
6 x 5.3 GHz Intel Raptor Cove P-Core
8 x 3.5 GHz Intel Gracemont E-Core
20 / 28
8 x 5.6 GHz Intel Raptor Cove P-Core
12 x 4.3 GHz Intel Gracemont E-Core
24 / 32
8 x 5.8 GHz Intel Raptor Cove P-Core
16 x 4.3 GHz Intel Gracemont E-Core
TDP125 Watt125 Watt65 Watt
Technology10 nm10 nm10 nm
max. Temp.100 °C100 °C100 °C
SocketLGA 1700LGA 1700LGA 1700
FeaturesIntel UHD Graphics 770, DDR5 5600 MT/s, DDR4 3200 MT/sIntel UHD Graphics 770, DDR5 5600 MT/s, DDR4 3200 MT/s
iGPUIntel UHD Graphics 770 (300 - 1550 MHz)Intel UHD Graphics 770 (300 - 1600 MHz)Intel UHD Graphics 770 (300 - 1650 MHz)
Architecturex86x86x86
$319 U.S.$409 U.S.$549 U.S.
Announced
Manufacturerwww.intel.comark.intel.comwww.intel.de
TDP Turbo PL2253 Watt219 Watt
Die Size257 mm2

Benchmarks

Performance Rating - CB R15 + R20 + 7-Zip + X265 + Blender + 3DM11 CPU - i5-14600K
44.2 pt (74%)
Restrict / Search: Model: Max. age: years
Performance Rating - CB R15 + R20 + 7-Zip + X265 + Blender + 3DM11 CPU - i7-14700K
47.6 pt (79%)
Restrict / Search: Model: Max. age: years
Performance Rating - CB R15 + R20 + 7-Zip + X265 + Blender + 3DM11 CPU - i9-14900
47.2 pt (79%)
Restrict / Search: Model: Max. age: years
Cinebench 2024 - Cinebench 2024 CPU Single Core
122 Points (69%)
min: 126     avg: 127     median: 127 (71%)     max: 127.9 Points
129 Points (72%)
Cinebench 2024 - Cinebench 2024 CPU Multi Core
1392 Points (26%)
min: 1559     avg: 1771     median: 1770.5 (33%)     max: 1982 Points
1245 Points (23%)
Cinebench R23 - Cinebench R23 Multi Core
24491 Points (23%)
min: 30989     avg: 33441     median: 33440.5 (31%)     max: 35892 Points
31070 Points (29%)
Cinebench R23 - Cinebench R23 Single Core
2064 Points (88%)
min: 2153     avg: 2160     median: 2160 (92%)     max: 2167 Points
2212 Points (94%)
Cinebench R20 - Cinebench R20 CPU (Single Core)
790 Points (88%)
min: 832     avg: 836     median: 836 (93%)     max: 840 Points
846 Points (94%)
Cinebench R20 - Cinebench R20 CPU (Multi Core)
9371 Points (23%)
min: 11814     avg: 12743     median: 12743 (31%)     max: 13672 Points
11291 Points (28%)
Cinebench R15 - Cinebench R15 CPU Multi 64 Bit
3640 Points (23%)
min: 4611     avg: 5035     median: 5035 (32%)     max: 5459 Points
4793 Points (30%)
Cinebench R15 - Cinebench R15 CPU Single 64 Bit
297 Points (83%)
min: 313     avg: 313.5     median: 313.5 (88%)     max: 314 Points
315 Points (88%)
Cinebench R11.5 - Cinebench R11.5 CPU Multi 64 Bit
41 Points (53%)
min: 54.22     avg: 57.8     median: 57.8 (75%)     max: 61.44 Points
56.6 Points (73%)
Cinebench R11.5 - Cinebench R11.5 CPU Single 64 Bit
3.6 Points (85%)
min: 3.7     avg: 3.7     median: 3.7 (89%)     max: 3.77 Points
3.8 Points (90%)
Cinebench R10 - Cinebench R10 Rend. Single (32bit)
11396 Points (69%)
min: 11745     avg: 11886     median: 11886 (72%)     max: 12027 Points
12284 Points (74%)
Cinebench R10 - Cinebench R10 Rend. Multi (32bit)
75358 Points (55%)
min: 91081     avg: 91124     median: 91123.5 (66%)     max: 91166 Points
82492 Points (60%)
Cinebench R10 - Cinebench R10 Rend. Multi (64bit)
115171 Points (74%)
min: 124651     avg: 130357     median: 130356 (83%)     max: 136062 Points
121768 Points (78%)
Cinebench R10 - Cinebench R10 Rend. Single (64bit)
16643 Points (20%)
min: 17400     avg: 17429     median: 17429 (21%)     max: 17458 Points
17590 Points (21%)
wPrime 2.10 - wPrime 2.0 1024m *
158.8 s (2%)
min: 50.891     avg: 80.3     median: 80.3 (1%)     max: 109.801 s
85.6 s (1%)
wPrime 2.10 - wPrime 2.0 32m *
2.4 s (0%)
min: 2.147     avg: 2.2     median: 2.2 (0%)     max: 2.252 s
2.4 s (0%)
WinRAR - WinRAR 4.0
11491 Points (18%)
min: 12800     avg: 12813     median: 12812.5 (20%)     max: 12825 Points
12359 Points (20%)
7-Zip 18.03 - 7-Zip 18.03 Multi Thread 4 runs
93235 MIPS (54%)
min: 117224     avg: 126436     median: 126436 (73%)     max: 135648 MIPS
101652 MIPS (58%)
7-Zip 18.03 - 7-Zip 18.03 Single Thread 4 runs
6910 MIPS (81%)
min: 7040     avg: 7196     median: 7195.5 (85%)     max: 7351 MIPS
7276 MIPS (86%)
X264 HD Benchmark 4.0 - x264 Pass 2
209 fps (70%)
min: 225.5     avg: 243.3     median: 243.3 (81%)     max: 261 fps
222 fps (74%)
X264 HD Benchmark 4.0 - x264 Pass 1
411 fps (95%)
min: 393.5     avg: 406.3     median: 406.3 (94%)     max: 419 fps
358.5 fps (83%)
HWBOT x265 Benchmark v2.2 - HWBOT x265 4k Preset
28.6 fps (50%)
min: 32.3     avg: 34.6     median: 34.6 (61%)     max: 36.8 fps
31.6 fps (56%)
TrueCrypt - TrueCrypt Serpent
1.8 GB/s (53%)
min: 2.2     avg: 2.4     median: 2.4 (71%)     max: 2.6 GB/s
2.4 GB/s (71%)
TrueCrypt - TrueCrypt Twofish
3.4 GB/s (59%)
min: 4.4     avg: 4.5     median: 4.5 (78%)     max: 4.6 GB/s
4.9 GB/s (84%)
TrueCrypt - TrueCrypt AES
19.5 GB/s (51%)
min: 18     avg: 21.8     median: 21.8 (57%)     max: 25.6 GB/s
18.5 GB/s (48%)
Blender - Blender 3.3 Classroom CPU *
223 Seconds (3%)
min: 155     avg: 181.5     median: 181.5 (2%)     max: 208 Seconds
263 Seconds (3%)
Blender - Blender 2.79 BMW27 CPU *
134 Seconds (1%)
min: 91     avg: 100     median: 100 (1%)     max: 109 Seconds
131 Seconds (1%)
R Benchmark 2.5 - R Benchmark 2.5 *
0.4 sec (9%)
min: 0.3788     avg: 0.4     median: 0.4 (8%)     max: 0.3826 sec
0.4 sec (8%)
3DMark 06 - CPU - 3DMark 06 - CPU
18096 Points (39%)
min: 11741     avg: 16203     median: 16203 (34%)     max: 20665 Points
18728 Points (40%)
Super Pi mod 1.5 XS 1M - Super Pi mod 1.5 XS 1M *
6.2 s (1%)
min: 5.953     avg: 6     median: 6 (1%)     max: 5.98 s
5.8 s (1%)
Super Pi mod 1.5 XS 2M - Super Pi mod 1.5 XS 2M *
13.7 s (1%)
min: 12.844     avg: 12.9     median: 12.9 (1%)     max: 12.894 s
12.6 s (1%)
Super Pi Mod 1.5 XS 32M - Super Pi mod 1.5 XS 32M *
316.7 s (1%)
min: 305.942     avg: 311     median: 311 (1%)     max: 316.148 s
303.4 s (1%)
3DMark Vantage - 3DM Vant. Perf. CPU no Physx
96263 Points (74%)
96298 Points (74%)
93183 Points (72%)
3DMark 11 - 3DM11 Performance Physics
31641 Points (79%)
min: 28739     avg: 30538     median: 30537.5 (76%)     max: 32336 Points
28622 Points (71%)
3DMark - 3DMark Ice Storm Physics
123069 Points (100%)
82048 Points (67%)
88787 Points (72%)
3DMark - 3DMark Ice Storm Extreme Physics
123244 Points (100%)
81495 Points (66%)
90442 Points (73%)
3DMark - 3DMark Ice Storm Unlimited Physics
109954 Points (91%)
85692 Points (71%)
93001 Points (77%)
3DMark - 3DMark Cloud Gate Physics
27407 Points (69%)
23358 Points (59%)
20179 Points (51%)
3DMark - 3DMark Fire Strike Standard Physics
40164 Points (72%)
min: 40312     avg: 44727     median: 44727 (80%)     max: 49142 Points
42316 Points (75%)
3DMark - 3DMark Time Spy CPU
18768 Points (79%)
min: 15951     avg: 18746     median: 18746 (79%)     max: 21541 Points
19492 Points (82%)
Geekbench 6.4 - Geekbench 6.4 Single-Core
2879 Points (72%)
min: 2902     avg: 2922     median: 2922 (73%)     max: 2942 Points
3022 Points (75%)
Geekbench 6.4 - Geekbench 6.4 Multi-Core
17409 Points (68%)
min: 18504     avg: 19147     median: 19147 (74%)     max: 19790 Points
15962 Points (62%)
Geekbench 6.0 - Geekbench 6.0 Single-Core
2764 Points (88%)
3105 Points (99%)
3105 Points (99%)
Geekbench 6.0 - Geekbench 6.0 Multi-Core
16875 Points (69%)
21003 Points (86%)
21003 Points (86%)
Geekbench 5.5 - Geekbench 5.1 - 5.5 64 Bit Single-Core
2017 Points (79%)
min: 2092     avg: 2107     median: 2106.5 (82%)     max: 2121 Points
2140 Points (84%)
Geekbench 5.5 - Geekbench 5.1 - 5.5 64 Bit Multi-Core
17516 Points (31%)
min: 19971     avg: 21565     median: 21565 (39%)     max: 23159 Points
17395 Points (31%)
Geekbench 5.0 - Geekbench 5.0 64 Bit Single-Core
2004 Points (9%)
min: 2039     avg: 2042     median: 2042 (9%)     max: 2045 Points
2077 Points (9%)
Geekbench 5.0 - Geekbench 5.0 64 Bit Multi-Core
17374 Points (55%)
min: 19766     avg: 21261     median: 21261 (67%)     max: 22756 Points
17218 Points (54%)
Geekbench 4.4 - Geekbench 4.1 - 4.4 64 Bit Single-Core
8904 Points (89%)
min: 8874     avg: 9089     median: 9089 (91%)     max: 9304 Points
9143 Points (91%)
Geekbench 4.4 - Geekbench 4.1 - 4.4 64 Bit Multi-Core
64035 Points (64%)
min: 72062     avg: 75782     median: 75781.5 (76%)     max: 79501 Points
67178 Points (67%)
Mozilla Kraken 1.1 - Kraken 1.1 Total Score *
450 ms (1%)
min: 439     avg: 439.5     median: 439.5 (1%)     max: 440 ms
436 ms (1%)
WebXPRT 4 - WebXPRT 4 Score
301 Points (83%)
min: 303     avg: 308.5     median: 308.5 (85%)     max: 314 Points
WebXPRT 3 - WebXPRT 3 Score
354 Points (64%)
min: 311     avg: 325     median: 325 (58%)     max: 339 Points
315 Points (57%)
CrossMark - CrossMark Overall
2310 Points (86%)
min: 2194     avg: 2241     median: 2241 (84%)     max: 2288 Points
2133 Points (80%)
Power Consumption - Prime95 Power Consumption - external Monitor *
370 Watt (64%)
min: 191.9     avg: 296     median: 296 (51%)     max: 400 Watt
145.5 Watt (25%)
Power Consumption - Cinebench R15 Multi Power Consumption - external Monitor *
329 Watt (60%)
min: 287     avg: 357.5     median: 357.5 (65%)     max: 428 Watt
253 Watt (46%)
Power Consumption - Idle Power Consumption - external Monitor *
110.4 Watt (73%)
min: 22.4     avg: 63.6     median: 63.6 (42%)     max: 104.8 Watt
29.9 Watt (20%)
Power Consumption - Power Efficiency - Cinebench R15 Multi external Monitor
11.1 Points per Watt (8%)
min: 12.8     avg: 14.5     median: 14.5 (11%)     max: 16.1 Points per Watt
18.9 Points per Watt (14%)

Average Benchmarks Intel Core i5-14600K → 100% n=53

Average Benchmarks Intel Core i7-14700K → 111% n=53

Average Benchmarks Intel Core i9-14900 → 106% n=53

- Range of benchmark values for this graphics card
red legend - Average benchmark values for this graphics card
* Smaller numbers mean a higher performance
1 This benchmark is not used for the average calculation

v1.33
log 25. 21:46:00

#0 ran 0s before starting gpusingle class +0s ... 0s

#1 checking url part for id 15093 +0s ... 0s

#2 checking url part for id 16391 +0s ... 0s

#3 checking url part for id 18150 +0s ... 0s

#4 not redirecting to Ajax server +0s ... 0s

#5 did not recreate cache, as it is less than 5 days old! Created at Fri, 25 Apr 2025 05:16:04 +0200 +0s ... 0s

#6 composed specs +0.004s ... 0.004s

#7 did output specs +0s ... 0.004s

#8 getting avg benchmarks for device 15093 +0.001s ... 0.006s

#9 got single benchmarks 15093 +0.001s ... 0.006s

#10 getting avg benchmarks for device 16391 +0.001s ... 0.007s

#11 got single benchmarks 16391 +0.001s ... 0.008s

#12 getting avg benchmarks for device 18150 +0.003s ... 0.011s

#13 got single benchmarks 18150 +0.005s ... 0.016s

#14 got avg benchmarks for devices +0s ... 0.016s

#15 min, max, avg, median took s +0.045s ... 0.061s

#16 return log +0s ... 0.061s

Please share our article, every link counts!
Mail Logo
> Expert Reviews and News on Laptops, Smartphones and Tech Innovations > Benchmarks / Tech > Processor Comparison - Head 2 Head
Redaktion, 2017-09- 8 (Update: 2023-07- 1)