

Intel Core i5-13500 vs Intel Core i5-14401TE
Intel Core i5-13500
► remove from comparison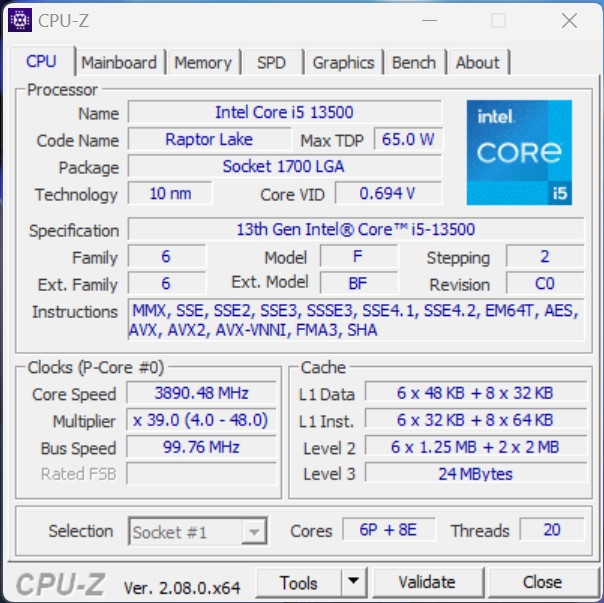
The Intel Core i5-13500 is a fast and relatively power efficient desktop processor based on the Raptor Lake architecture, which was introduced in October 2022. The processor offers a base clock of 2.5 GHz and reaches up to 4.8 GHz in Turbo. The hybrid CPU architecture introduced with Alder Lake is also used in the Raptor Lake processors. Compared to the Intel Core i5-12500, the Intel Core i5-13500 offers more cores, which means a higher overall performance can be achieved. In total, the Intel Core i5-13500 can process up to 20 threads in parallel. The performance cores (P cores) offer hyperthreading for this purpose, which is withheld from the energy-efficient cores (E cores).
Performance
Due to the higher number of physical computing units, the Intel Core i5-13500 offers noticeably more performance compared to the Intel Core i5-12500. Both processors have 6 P-cores, although only the Intel Core i5-13500 is additionally equipped with 8 E-cores.
Graphics unit
Like the Intel Core i5-12600K, the Intel Core i5-13500 offers an integrated graphics unit. The Intel Iris Xe architecture continues to serve as the basis. In terms of performance, however, not much has changed with the new Intel UHD Graphics 770.
Power consumption
The TDP of the Intel Core i5-13500 is 65 watts, with the option to increase this to up to 154 watts in Turbo mode. Compared to the Intel Core i5-12500, the energy requirement increases slightly.
Intel Core i5-14401TE
► remove from comparisonThe Intel Core i5-14401TE is a peculiar Raptor Lake family desktop processor (SoC) that has 6 performance cores but 0 efficient cores. It's the lack of E-cores that makes 14X01 chips special.
The product has decently sized level 2 and 3 caches at 12 MB and 24 MB, respectively. Its CPU cores run at up to 4.5 GHz. The UHD 730 serves as the integrated graphics solution. There is no 'proper' NPU here.
The i5 chip is manufactured using the Intel 7 process which is fairly old, as of mid 2025. Its base TDP sits at 45 W by default meaning at least one fan is required to keep it cool.
Performance
While we have not tested a single 14X01 processor as of May 2025, we do know that a single 4.6 GHz Raptor Cove core, like that of an i5-13450HX is good for 102 Cinebench 2024 points and 246 Cinebench R15 points. (The 14401TE is limited to 4.5 GHz, to remind you.) If we multiply the values by 6, we get a reasonably fair projection that sees the 14401TE going neck-and-neck with newer but not particularly powerful chips like Intel's Ultra 5 228V (Lunar Lake product family) as well as older chips of the more powerful kind, like AMD's Ryzen 7 5800H (Cezanne family, Zen 3 architecture). While not particularly impressive, this is most certainly sufficient for any tasks and applications one could run in 2025, top games included.
| Model | Intel Core i5-13500 | Intel Core i5-14401TE | ||||||||||||||||||||||||||||||||||||||||||||||||||||||||||||||||||||||||||||||||
| Codename | Raptor Lake | Raptor Lake | ||||||||||||||||||||||||||||||||||||||||||||||||||||||||||||||||||||||||||||||||
| Series | Intel Raptor Lake-S | Intel Raptor Lake-S | ||||||||||||||||||||||||||||||||||||||||||||||||||||||||||||||||||||||||||||||||
| Series: Raptor Lake-S Raptor Lake |
|
| ||||||||||||||||||||||||||||||||||||||||||||||||||||||||||||||||||||||||||||||||
| Clock | 2500 - 4800 MHz | 2000 - 4500 MHz | ||||||||||||||||||||||||||||||||||||||||||||||||||||||||||||||||||||||||||||||||
| L2 Cache | 11.5 MB | 6 MB | ||||||||||||||||||||||||||||||||||||||||||||||||||||||||||||||||||||||||||||||||
| L3 Cache | 24 MB | 12 MB | ||||||||||||||||||||||||||||||||||||||||||||||||||||||||||||||||||||||||||||||||
| Cores / Threads | 14 / 20 6 x 4.8 GHz Intel Raptor Cove P-Core 8 x 3.5 GHz Intel Gracemont E-Core | 6 / 12 6 x 4.5 GHz Intel Raptor Cove P-Core | ||||||||||||||||||||||||||||||||||||||||||||||||||||||||||||||||||||||||||||||||
| TDP | 65 Watt | 45 Watt | ||||||||||||||||||||||||||||||||||||||||||||||||||||||||||||||||||||||||||||||||
| TDP Turbo PL2 | 154 Watt | |||||||||||||||||||||||||||||||||||||||||||||||||||||||||||||||||||||||||||||||||
| Technology | 10 nm | 10 nm | ||||||||||||||||||||||||||||||||||||||||||||||||||||||||||||||||||||||||||||||||
| Die Size | 215 mm2 | |||||||||||||||||||||||||||||||||||||||||||||||||||||||||||||||||||||||||||||||||
| max. Temp. | 100 °C | |||||||||||||||||||||||||||||||||||||||||||||||||||||||||||||||||||||||||||||||||
| Socket | LGA 1700 | LGA1700 | ||||||||||||||||||||||||||||||||||||||||||||||||||||||||||||||||||||||||||||||||
| Features | Intel UHD Graphics 770, DDR5 4800 MT/s, DDR4 3200 MT/s | DDR4-3200/DDR5-4800 RAM, PCIe 5 + PCIe 4, DL Boost, GNA, MMX, SSE, SSE2, SSE3, SSSE3, SSE4.1, SSE4.2, AVX, AVX2, BMI2, ABM, FMA, ADX, SMEP, SMAP, EIST, TM1, TM2, HT, Turbo, SST, AES-NI, RDRAND, RDSEED, SHA | ||||||||||||||||||||||||||||||||||||||||||||||||||||||||||||||||||||||||||||||||
| iGPU | Intel UHD Graphics 770 (300 - 1550 MHz) | Intel UHD Graphics 730 (Rocket Lake) ( - 1550 MHz) | ||||||||||||||||||||||||||||||||||||||||||||||||||||||||||||||||||||||||||||||||
| Architecture | x86 | x86 | ||||||||||||||||||||||||||||||||||||||||||||||||||||||||||||||||||||||||||||||||
| Announced | ||||||||||||||||||||||||||||||||||||||||||||||||||||||||||||||||||||||||||||||||||
| Manufacturer | www.intel.de | www.intel.com |

Benchmarks

Average Benchmarks Intel Core i5-13500 → 100% n=2
Average Benchmarks Intel Core i5-14401TE → 91% n=2
* Smaller numbers mean a higher performance
1 This benchmark is not used for the average calculation