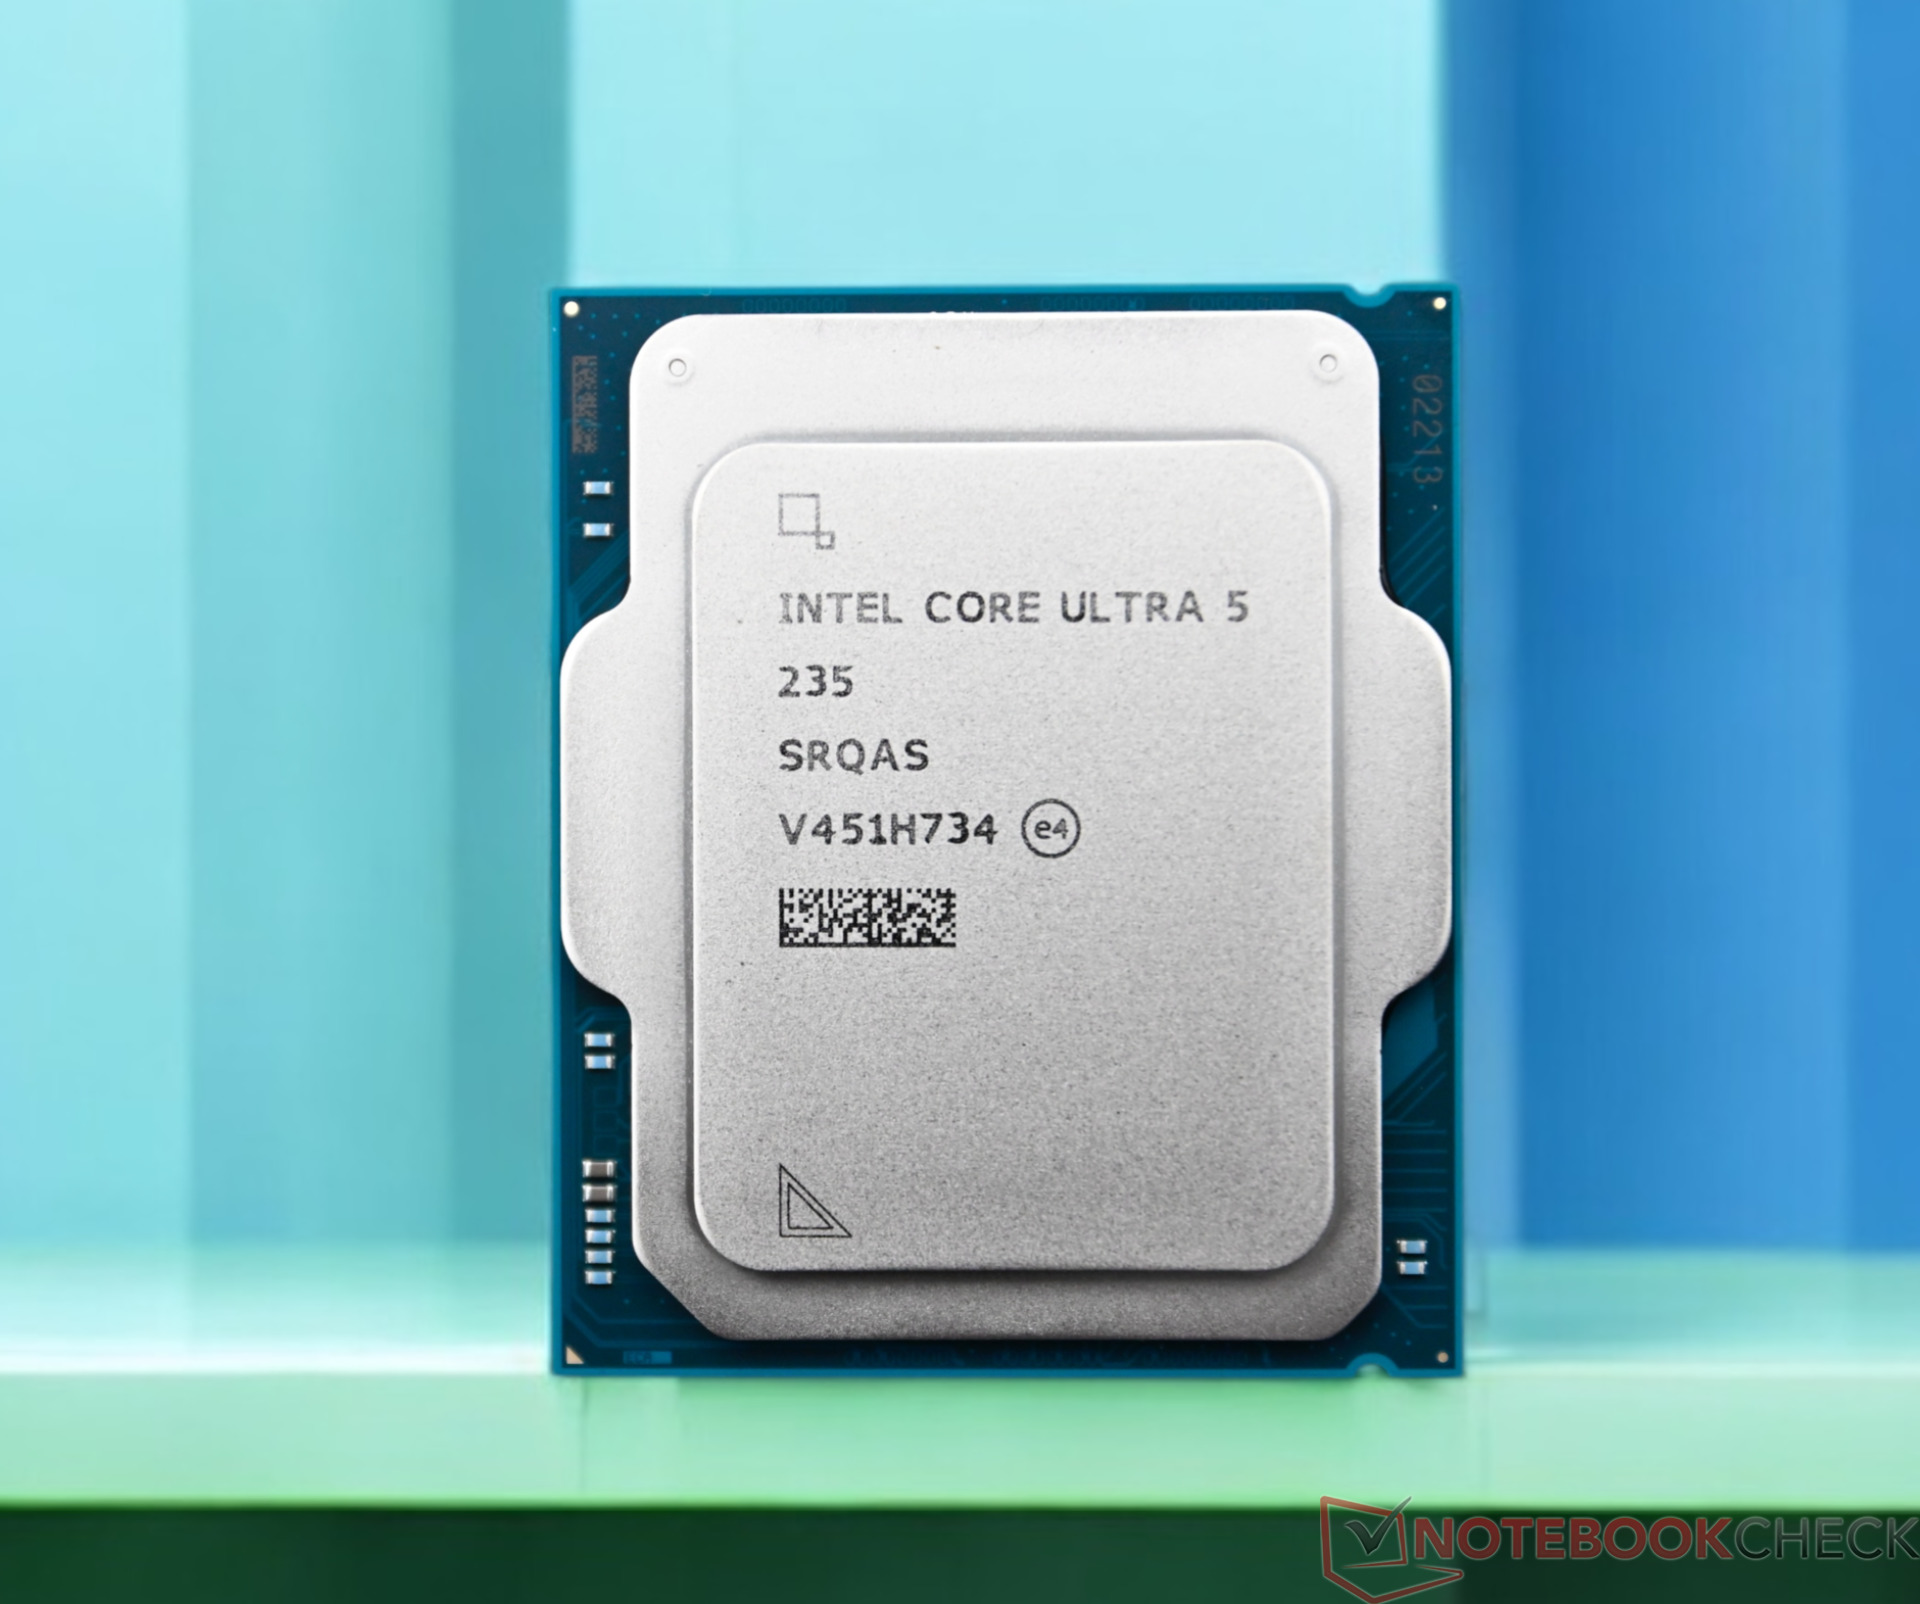
Intel Core Ultra 5 235 ► remove from comparison The Intel Core Ultra 5 235 is a desktop processor based on the Arrow Lake-S series that was introduced at the beginning of 2025. It offers 14 cores divided in 6 performance cores with up to 5 GHz and 8 efficiency cores with up to 4.4 GHz.
The CPU performance is comparable to the old Intel Core i5-13600K and therefore well suited for demanding tasks.
The Arrow Lake-S chips are composed of several chiplets . The CPU part is manufactured at TSMC in the modern N3B (3nm) process, the GPU also comes from TSMC in the N5P process. The SoC and I/O tile are manufactured in the TSMC N6 process. The base tile is manufactured by Intel in the 22nm process and carries the individual chiplets thanks to Fovero's 3D packaging.
The TDP is specified at 65 watts (long-term) to 121 watts (Turbo).
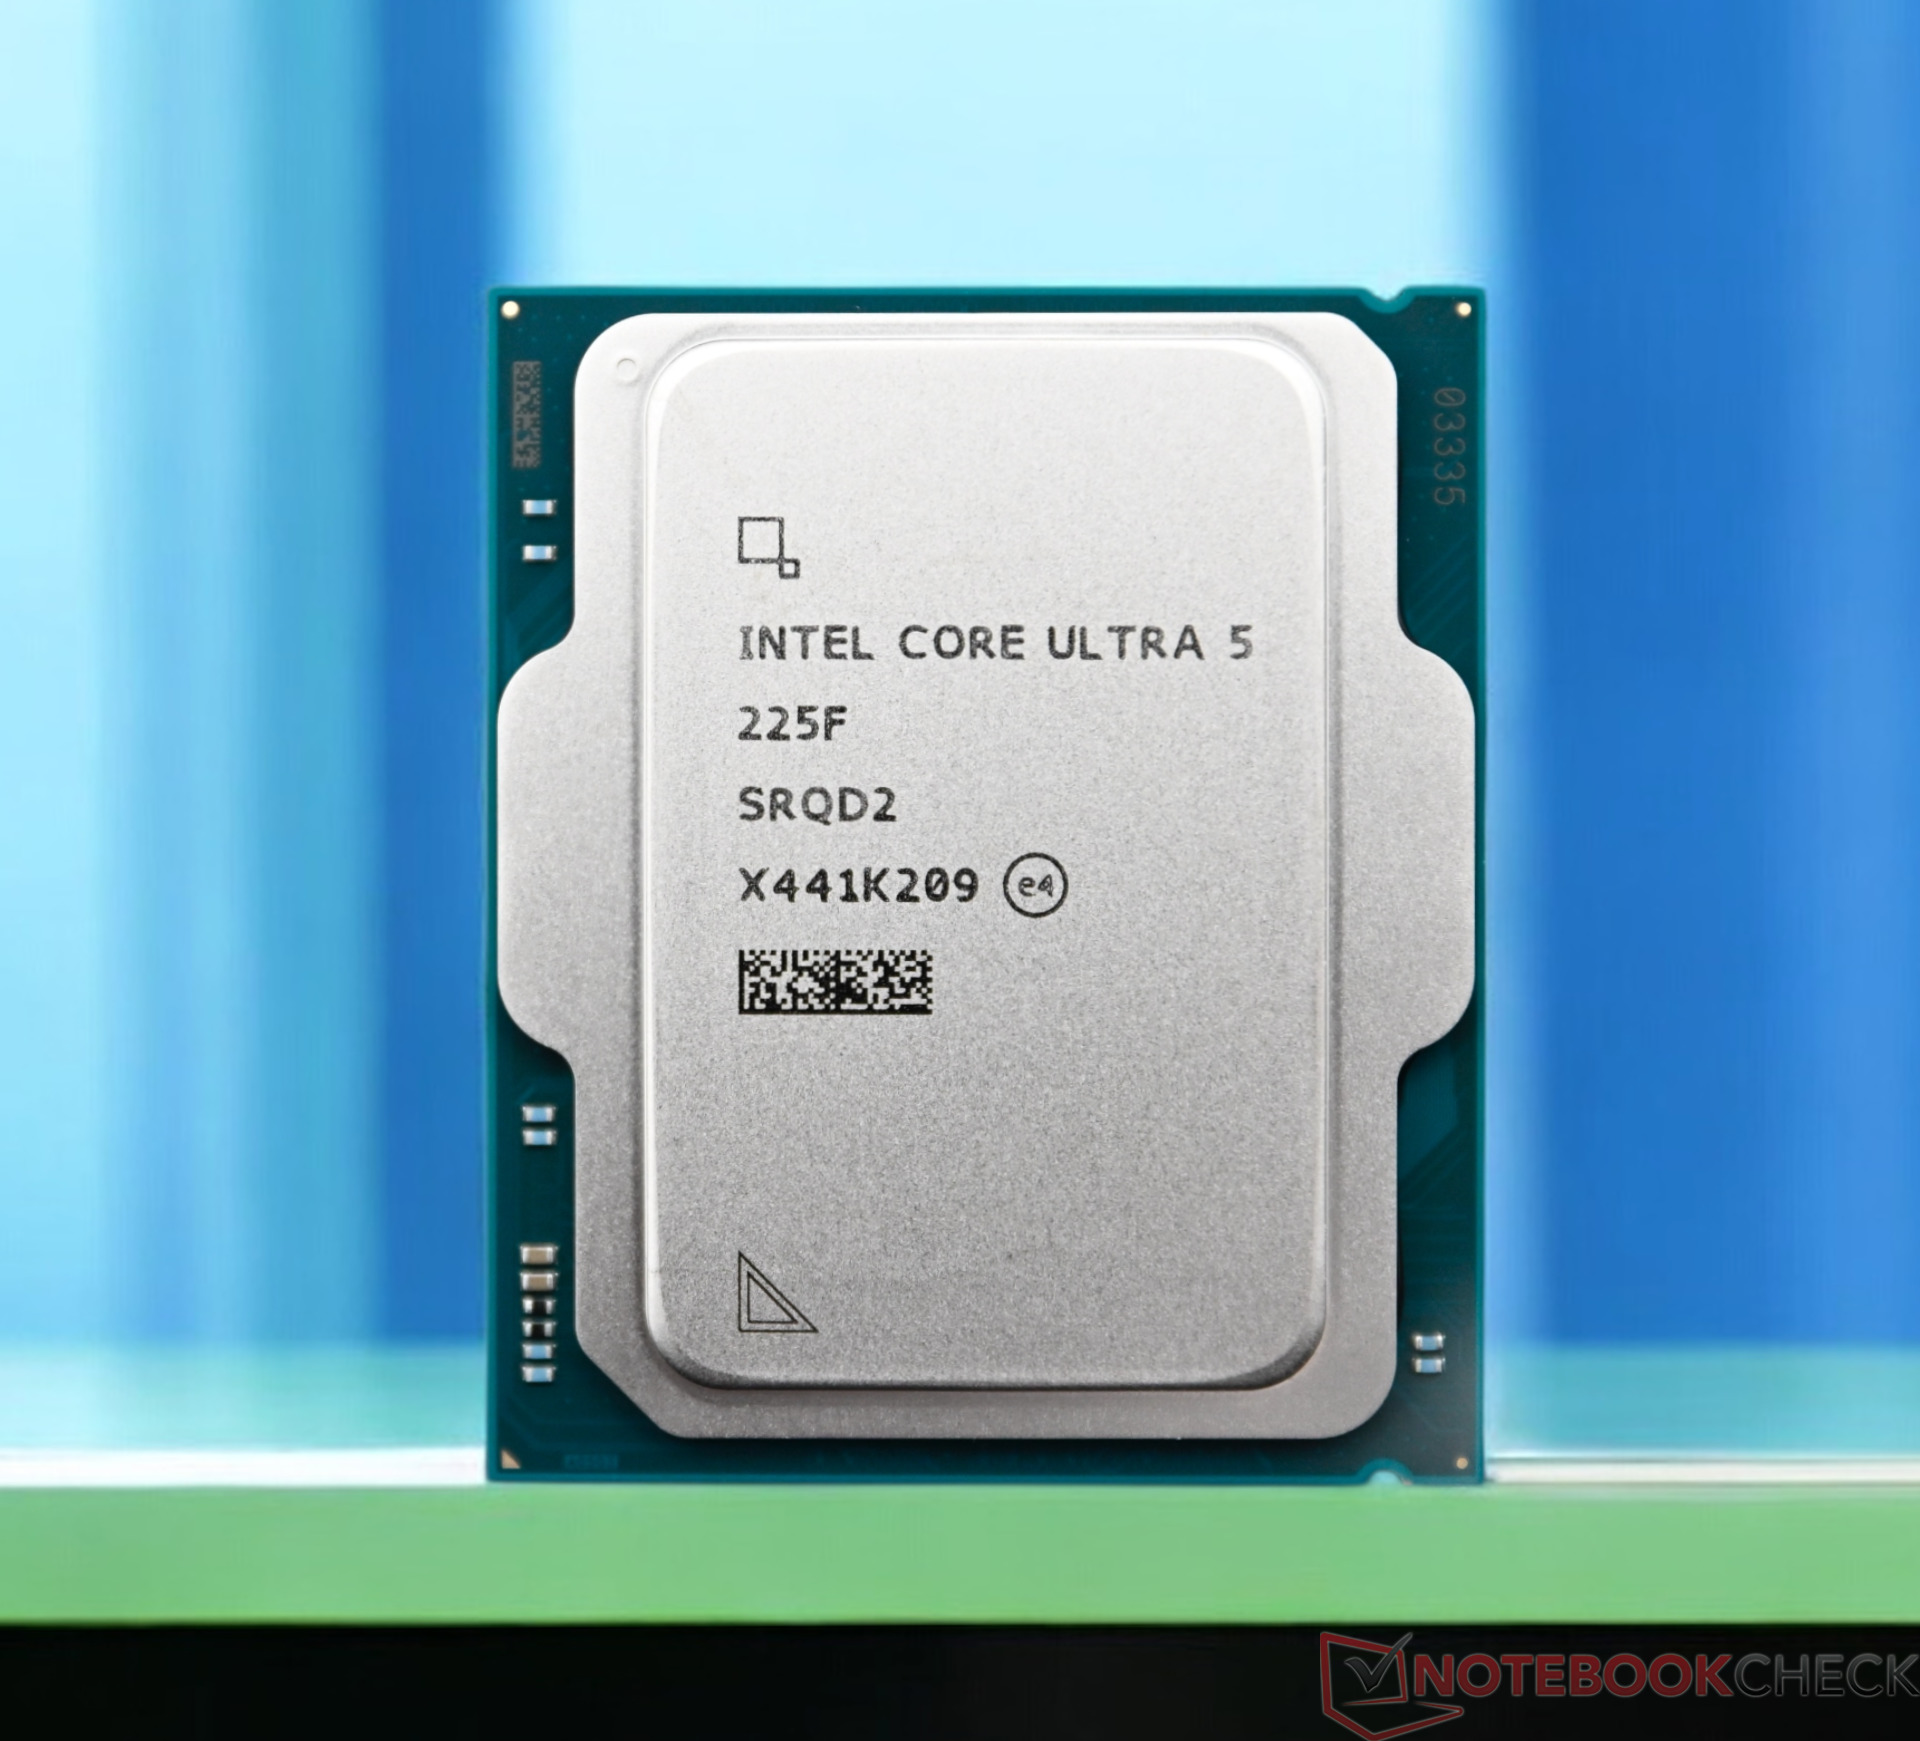
Intel Core Ultra 5 225F ► remove from comparison The Intel Core Ultra 5 225F is a relatively power efficient desktop processor of the Arrow Lake generation. It integrates 10 cores in two clusters. The 6 performance cores (Lion Cove P-Cores) clock from 3.3 to 4.9 GHz and the 4 efficiency cores (Skymont E-Cores) clock from 2.7 to 4.4 GHz. The CPU has access to 20 MB Smart Cache and 22 MB L2 Cache.
Detailed benchmarks and measured values can be found in our detailed test report on the Core Ultra 5 225F .
The F series is specified with a TDP of 65 watts and is therefore also suitable for smaller desktop PCs with air cooling.
Model Intel Core Ultra 5 245K Intel Core Ultra 5 235 Intel Core Ultra 5 225F Codename Arrow Lake-S Arrow Lake-S Arrow Lake-S Series Intel Arrow Lake Intel Arrow Lake Intel Arrow Lake Series: Arrow Lake Arrow Lake-S Clock 3600 - 5200 MHz 3400 - 5000 MHz 3300 - 4900 MHz L2 Cache 26 MB 26 MB 22 MB L3 Cache 24 MB 24 MB 20 MB Cores / Threads 14 / 14 14 / 14 10 / 10 TDP 125 Watt 65 Watt 65 Watt TDP Turbo PL2 159 Watt 121 Watt 121 Watt iGPU Intel Graphics 4-Core iGPU (Arc) ( - 1900 MHz)Intel Graphics 4-Core iGPU (Arc) (300 - 2000 MHz)Architecture x86 x86 x86 Announced Manufacturer ark.intel.com www.intel.de www.intel.de Socket LGA1851 LGA1851 $247 U.S. $221 U.S. max. Temp. 105 °C
Performance Rating - CB R15 + R20 + 7-Zip + X265 + Blender + 3DM11 CPU - Ultra 5 245K
...
Intel Core Ultra 5 235
...
Performance Rating - CB R15 + R20 + 7-Zip + X265 + Blender + 3DM11 CPU - Ultra 5 235
Performance Rating - CB R15 + R20 + 7-Zip + X265 + Blender + 3DM11 CPU - Ultra 5 225F
Cinebench 2024 - Cinebench 2024 CPU Single Core
CPU TDP 65 W TDP 159 W 96% 100%
CPU TDP 65 W TDP 159 W 93% 100%
Cinebench 2024 - Cinebench 2024 CPU Multi Core
CPU TDP 65 W TDP 159 W 80% 100%
CPU TDP 65 W TDP 159 W 71% 100%
Cinebench R23 - Cinebench R23 Multi Core
CPU TDP 65 W TDP 159 W 86% 100%
CPU TDP 65 W TDP 159 W 76% 100%
Cinebench R23 - Cinebench R23 Single Core
CPU TDP 65 W TDP 159 W 96% 100%
CPU TDP 65 W TDP 159 W 93% 100%
Cinebench R20 - Cinebench R20 CPU (Single Core)
CPU TDP 65 W TDP 159 W 97% 100%
CPU TDP 65 W TDP 159 W 93% 100%
Cinebench R20 - Cinebench R20 CPU (Multi Core)
CPU TDP 65 W TDP 159 W 87% 100%
CPU TDP 65 W TDP 159 W 76% 100%
Cinebench R15 - Cinebench R15 CPU Multi 64 Bit
CPU TDP 65 W TDP 159 W 95% 100%
CPU TDP 65 W TDP 159 W 82% 100%
Cinebench R15 - Cinebench R15 CPU Single 64 Bit
CPU TDP 65 W TDP 159 W 97% 100%
CPU TDP 65 W TDP 159 W 93% 100%
Cinebench R11.5 - Cinebench R11.5 CPU Multi 64 Bit
CPU TDP 65 W TDP 159 W 93% 100%
CPU TDP 65 W TDP 159 W 81% 100%
Cinebench R11.5 - Cinebench R11.5 CPU Single 64 Bit
CPU TDP 65 W TDP 159 W 99% 100%
CPU TDP 65 W TDP 159 W 96% 100%
Cinebench R10 - Cinebench R10 Rend. Single (32bit)
CPU TDP 65 W TDP 159 W 98% 100%
CPU TDP 65 W TDP 159 W 96% 100%
Cinebench R10 - Cinebench R10 Rend. Multi (32bit)
CPU TDP 65 W TDP 159 W 93% 100%
CPU TDP 65 W TDP 159 W 85% 100%
Cinebench R10 - Cinebench R10 Rend. Multi (64bit)
CPU TDP 65 W TDP 159 W 91% 100%
CPU TDP 65 W TDP 159 W 85% 100%
Cinebench R10 - Cinebench R10 Rend. Single (64bit)
CPU TDP 65 W TDP 159 W 97% 100%
CPU TDP 65 W TDP 159 W 96% 100%
wPrime 2.10 - wPrime 2.0 1024m *
CPU TDP 65 W TDP 159 W 100% 100%
CPU TDP 65 W TDP 159 W 100% 100%
wPrime 2.10 - wPrime 2.0 32m *
CPU TDP 65 W TDP 159 W 100% 100%
CPU TDP 65 W TDP 159 W 100% 100%
CPU TDP 65 W TDP 159 W 94% 100%
CPU TDP 65 W TDP 159 W 89% 100%
7-Zip 18.03 - 7-Zip 18.03 Multi Thread 4 runs
CPU TDP 65 W TDP 159 W 91% 100%
CPU TDP 65 W TDP 159 W 80% 100%
7-Zip 18.03 - 7-Zip 18.03 Single Thread 4 runs
CPU TDP 65 W TDP 159 W 100% 100%
CPU TDP 65 W TDP 159 W 96% 100%
X264 HD Benchmark 4.0 - x264 Pass 2
CPU TDP 65 W TDP 159 W 93% 100%
CPU TDP 65 W TDP 159 W 81% 100%
X264 HD Benchmark 4.0 - x264 Pass 1
CPU TDP 65 W TDP 159 W 97% 100%
CPU TDP 65 W TDP 159 W 96% 100%
HWBOT x265 Benchmark v2.2 - HWBOT x265 4k Preset
CPU TDP 65 W TDP 159 W 84% 100%
CPU TDP 65 W TDP 159 W 77% 100%
TrueCrypt - TrueCrypt Serpent
CPU TDP 65 W TDP 159 W 93% 100%
CPU TDP 65 W TDP 159 W 80% 100%
TrueCrypt - TrueCrypt Twofish
CPU TDP 65 W TDP 159 W 93% 100%
CPU TDP 65 W TDP 159 W 82% 100%
TrueCrypt - TrueCrypt AES
CPU TDP 65 W TDP 159 W 97% 100%
CPU TDP 65 W TDP 159 W 84% 100%
Blender - Blender 3.3 Classroom CPU *
CPU TDP 65 W TDP 159 W 100% 101%
CPU TDP 65 W TDP 159 W 100% 101%
Blender - Blender 2.79 BMW27 CPU *
CPU TDP 65 W TDP 159 W 100% 100%
CPU TDP 65 W TDP 159 W 100% 100%
R Benchmark 2.5 - R Benchmark 2.5 *
min: 0.4058 avg: 0.4 median: 0.4 (9%) max: 0.4086 sec
CPU TDP 65 W TDP 159 W 100% 100%
CPU TDP 65 W TDP 159 W 100% 101%
3DMark 06 - CPU - 3DMark 06 - CPU
CPU TDP 65 W TDP 159 W 99% 100%
CPU TDP 65 W TDP 159 W 93% 100%
Super Pi mod 1.5 XS 1M - Super Pi mod 1.5 XS 1M *
CPU TDP 65 W TDP 159 W 100% 100%
CPU TDP 65 W TDP 159 W 100% 100%
Super Pi mod 1.5 XS 2M - Super Pi mod 1.5 XS 2M *
CPU TDP 65 W TDP 159 W 100% 100%
CPU TDP 65 W TDP 159 W 100% 100%
3DMark Vantage - 3DM Vant. Perf. CPU no Physx
CPU TDP 65 W TDP 159 W 90% 100%
CPU TDP 65 W TDP 159 W 80% 100%
3DMark 11 - 3DM11 Performance Physics
CPU TDP 65 W TDP 159 W 100% 100%
CPU TDP 65 W TDP 159 W 90% 100%
3DMark - 3DMark Ice Storm Physics
CPU TDP 65 W TDP 159 W 97% 100%
CPU TDP 65 W TDP 159 W 98% 100%
3DMark - 3DMark Ice Storm Extreme Physics
CPU TDP 65 W TDP 159 W 98% 100%
CPU TDP 65 W TDP 159 W 99% 100%
3DMark - 3DMark Ice Storm Unlimited Physics
CPU TDP 65 W TDP 159 W 97% 100%
CPU TDP 65 W TDP 159 W 98% 100%
3DMark - 3DMark Cloud Gate Physics
CPU TDP 65 W TDP 159 W 97% 100%
CPU TDP 65 W TDP 159 W 87% 100%
3DMark - 3DMark Fire Strike Standard Physics
CPU TDP 65 W TDP 159 W 99% 100%
CPU TDP 65 W TDP 159 W 91% 100%
3DMark - 3DMark Time Spy CPU
CPU TDP 65 W TDP 159 W 100% 93%
CPU TDP 65 W TDP 159 W 91% 100%
Geekbench 6.5 - Geekbench 6.5 Single-Core
CPU TDP 65 W TDP 159 W 98% 100%
CPU TDP 65 W TDP 159 W 96% 100%
Geekbench 6.5 - Geekbench 6.5 Multi-Core
CPU TDP 65 W TDP 159 W 99% 100%
CPU TDP 65 W TDP 159 W 92% 100%
Geekbench 5.5 - Geekbench 5.1 - 5.5 64 Bit Single-Core
CPU TDP 65 W TDP 159 W 98% 100%
CPU TDP 65 W TDP 159 W 96% 100%
Geekbench 5.5 - Geekbench 5.1 - 5.5 64 Bit Multi-Core
CPU TDP 65 W TDP 159 W 100% 100%
CPU TDP 65 W TDP 159 W 89% 100%
Geekbench 5.0 - Geekbench 5.0 64 Bit Single-Core
CPU TDP 65 W TDP 159 W 98% 100%
CPU TDP 65 W TDP 159 W 95% 100%
Geekbench 5.0 - Geekbench 5.0 64 Bit Multi-Core
CPU TDP 65 W TDP 159 W 98% 100%
CPU TDP 65 W TDP 159 W 88% 100%
Geekbench 4.4 - Geekbench 4.1 - 4.4 64 Bit Single-Core
CPU TDP 65 W TDP 159 W 99% 100%
CPU TDP 65 W TDP 159 W 97% 100%
Geekbench 4.4 - Geekbench 4.1 - 4.4 64 Bit Multi-Core
CPU TDP 65 W TDP 159 W 100% 100%
CPU TDP 65 W TDP 159 W 88% 100%
Mozilla Kraken 1.1 - Kraken 1.1 Total Score *
CPU TDP 65 W TDP 159 W 100% 100%
CPU TDP 65 W TDP 159 W 100% 100%
WebXPRT 4 - WebXPRT 4 Score
CPU TDP 65 W TDP 159 W 98% 100%
CPU TDP 65 W TDP 159 W 97% 100%
WebXPRT 3 - WebXPRT 3 Score
CPU TDP 65 W TDP 159 W 95% 100%
CPU TDP 65 W TDP 159 W 94% 100%
CrossMark - CrossMark Overall
CPU TDP 65 W TDP 159 W 95% 100%
CPU TDP 65 W TDP 159 W 92% 100%
Power Consumption - Prime95 Power Consumption - external Monitor *
CPU TDP 65 W TDP 159 W 132% 100%
CPU TDP 65 W TDP 159 W 131% 100%
Power Consumption - Cinebench R15 Multi Power Consumption - external Monitor *
CPU TDP 65 W TDP 159 W 106% 100%
CPU TDP 65 W TDP 159 W 111% 100%
Power Consumption - Idle Power Consumption - external Monitor *
CPU TDP 65 W TDP 159 W 103% 100%
CPU TDP 65 W TDP 159 W 101% 100%
Power Consumption - Power Efficiency - Cinebench R15 Multi external Monitor
15.8 Points per Watt (12%)
16.2 Points per Watt (12%)
CPU TDP 65 W TDP 159 W 100% 98%
13.7 Points per Watt (10%)
CPU TDP 65 W TDP 159 W 95% 100%
Average Benchmarks Intel Core Ultra 5 245K → 100% n=51 Average Benchmarks Intel Core Ultra 5 235 → 95% n=51 Average Benchmarks Intel Core Ultra 5 225F → 82% n=51
- Range of benchmark values for this graphics card
- Average benchmark values for this graphics card
* Smaller numbers mean a higher performance
1 This benchmark is not used for the average calculation
log 30. 05:01:55
#0 ran 0s before starting gpusingle class +0s ... 0s
#1 checking url part for id 18014 +0s ... 0s
#2 checking url part for id 19651 +0s ... 0s
#3 checking url part for id 19654 +0s ... 0s
#4 not redirecting to Ajax server +0s ... 0s
#5 did not recreate cache, as it is less than 5 days old! Created at Mon, 29 Sep 2025 12:06:34 +0200 +0s ... 0s
#6 composed specs +0.003s ... 0.003s
#7 did output specs +0s ... 0.003s
#8 getting avg benchmarks for device 18014 +0.001s ... 0.004s
#9 got single benchmarks 18014 +0s ... 0.005s
#10 getting avg benchmarks for device 19651 +0.001s ... 0.006s
#11 got single benchmarks 19651 +0s ... 0.006s
#12 getting avg benchmarks for device 19654 +0.004s ... 0.01s
#13 got single benchmarks 19654 +0.005s ... 0.014s
#14 got avg benchmarks for devices +0s ... 0.014s
#15 min, max, avg, median took s +0.054s ... 0.068s
#16 return log +0s ... 0.068s