Notebookcheck Logo

NVIDIA T1000 vs NVIDIA T600 Laptop GPU vs NVIDIA T600

NVIDIA T1000

► remove from comparison

The Nvidia T1000 is a professional desktop graphics card for small entry-level workstations. It is based on the same TU117 Turing chip as the consumer GeForce GTX1650. The number of shader units is also identical at 896. With 8 GB VRAM, the Nvidia T1000 however offers more VRAM, which is still connected via a 128 bit memory bus. The power consumption of the Nvidia T1000 is only rated at 50 watts and therefore does not require an additional power connection.

The professional graphics cards offer certified drivers which are optimized for stability and performance in professional applications (CAD, DCC, medical, prospecting, visualization applications). As a result, the performance in these areas is significantly better compared to consumer graphics cards with the same chip.

In contrast to the more powerful RTX cards (e.g. Quadro RTX 3000), they do not offer ray tracing and tensor cores. The Turing architecture has also seen significant improvements at the CUDA core level. Float and INT operations can now be executed simultaneously, the cache has been standardized and improved and adaptive shading has been introduced. As a result, Nvidia claims up to 50% higher performance per core compared to Pascal.

NVIDIA T600 Laptop GPU

► remove from comparison NVIDIA T600 Laptop GPU

The Nvidia T600 Laptop GPU (or Quadro T600 for laptops) is a professional mobile graphics card that is based on the Turing architecture (TU117 chip). It is similar to the consumer GTX 1650 with 896 CUDA cores and a 128 Bit memory bus for GDDR6 graphics memory (10 Gbits). The chip is manufactured in 12nm FinFET at TSMC. The T600 was introduced as a refresh together with the T1200 and should be slightly slower than the older Quadro T1000 (2.6 versus 2.5 TFLOPS peak SP performance).

The Turing generation did not only introduce raytracing for the RTX cards, but also optimized the architecture of the cores and caches. According to Nvidia the CUDA cores offer now a concurrent execution of floating point and integer operations for increased performance in compute-heavy workloads of modern games.

Furthermore, the caches were reworked (new unified memory architecture with twice the cache compared to Pascal). This leads to up to 50% more instructions per clock and a 40% more power efficient usage compared to Pascal. In contrary to the faster Quadro RTX cards, the T600 do not feature raytracing and Tensor cores.

Currently Nvidia only specifies the TDP of 25 Watt (the older T1000 had a TGP of 40-50 Watt). Therefore, the T600 should be well suited for thin and light laptops.

NVIDIA T600

► remove from comparison NVIDIA T600

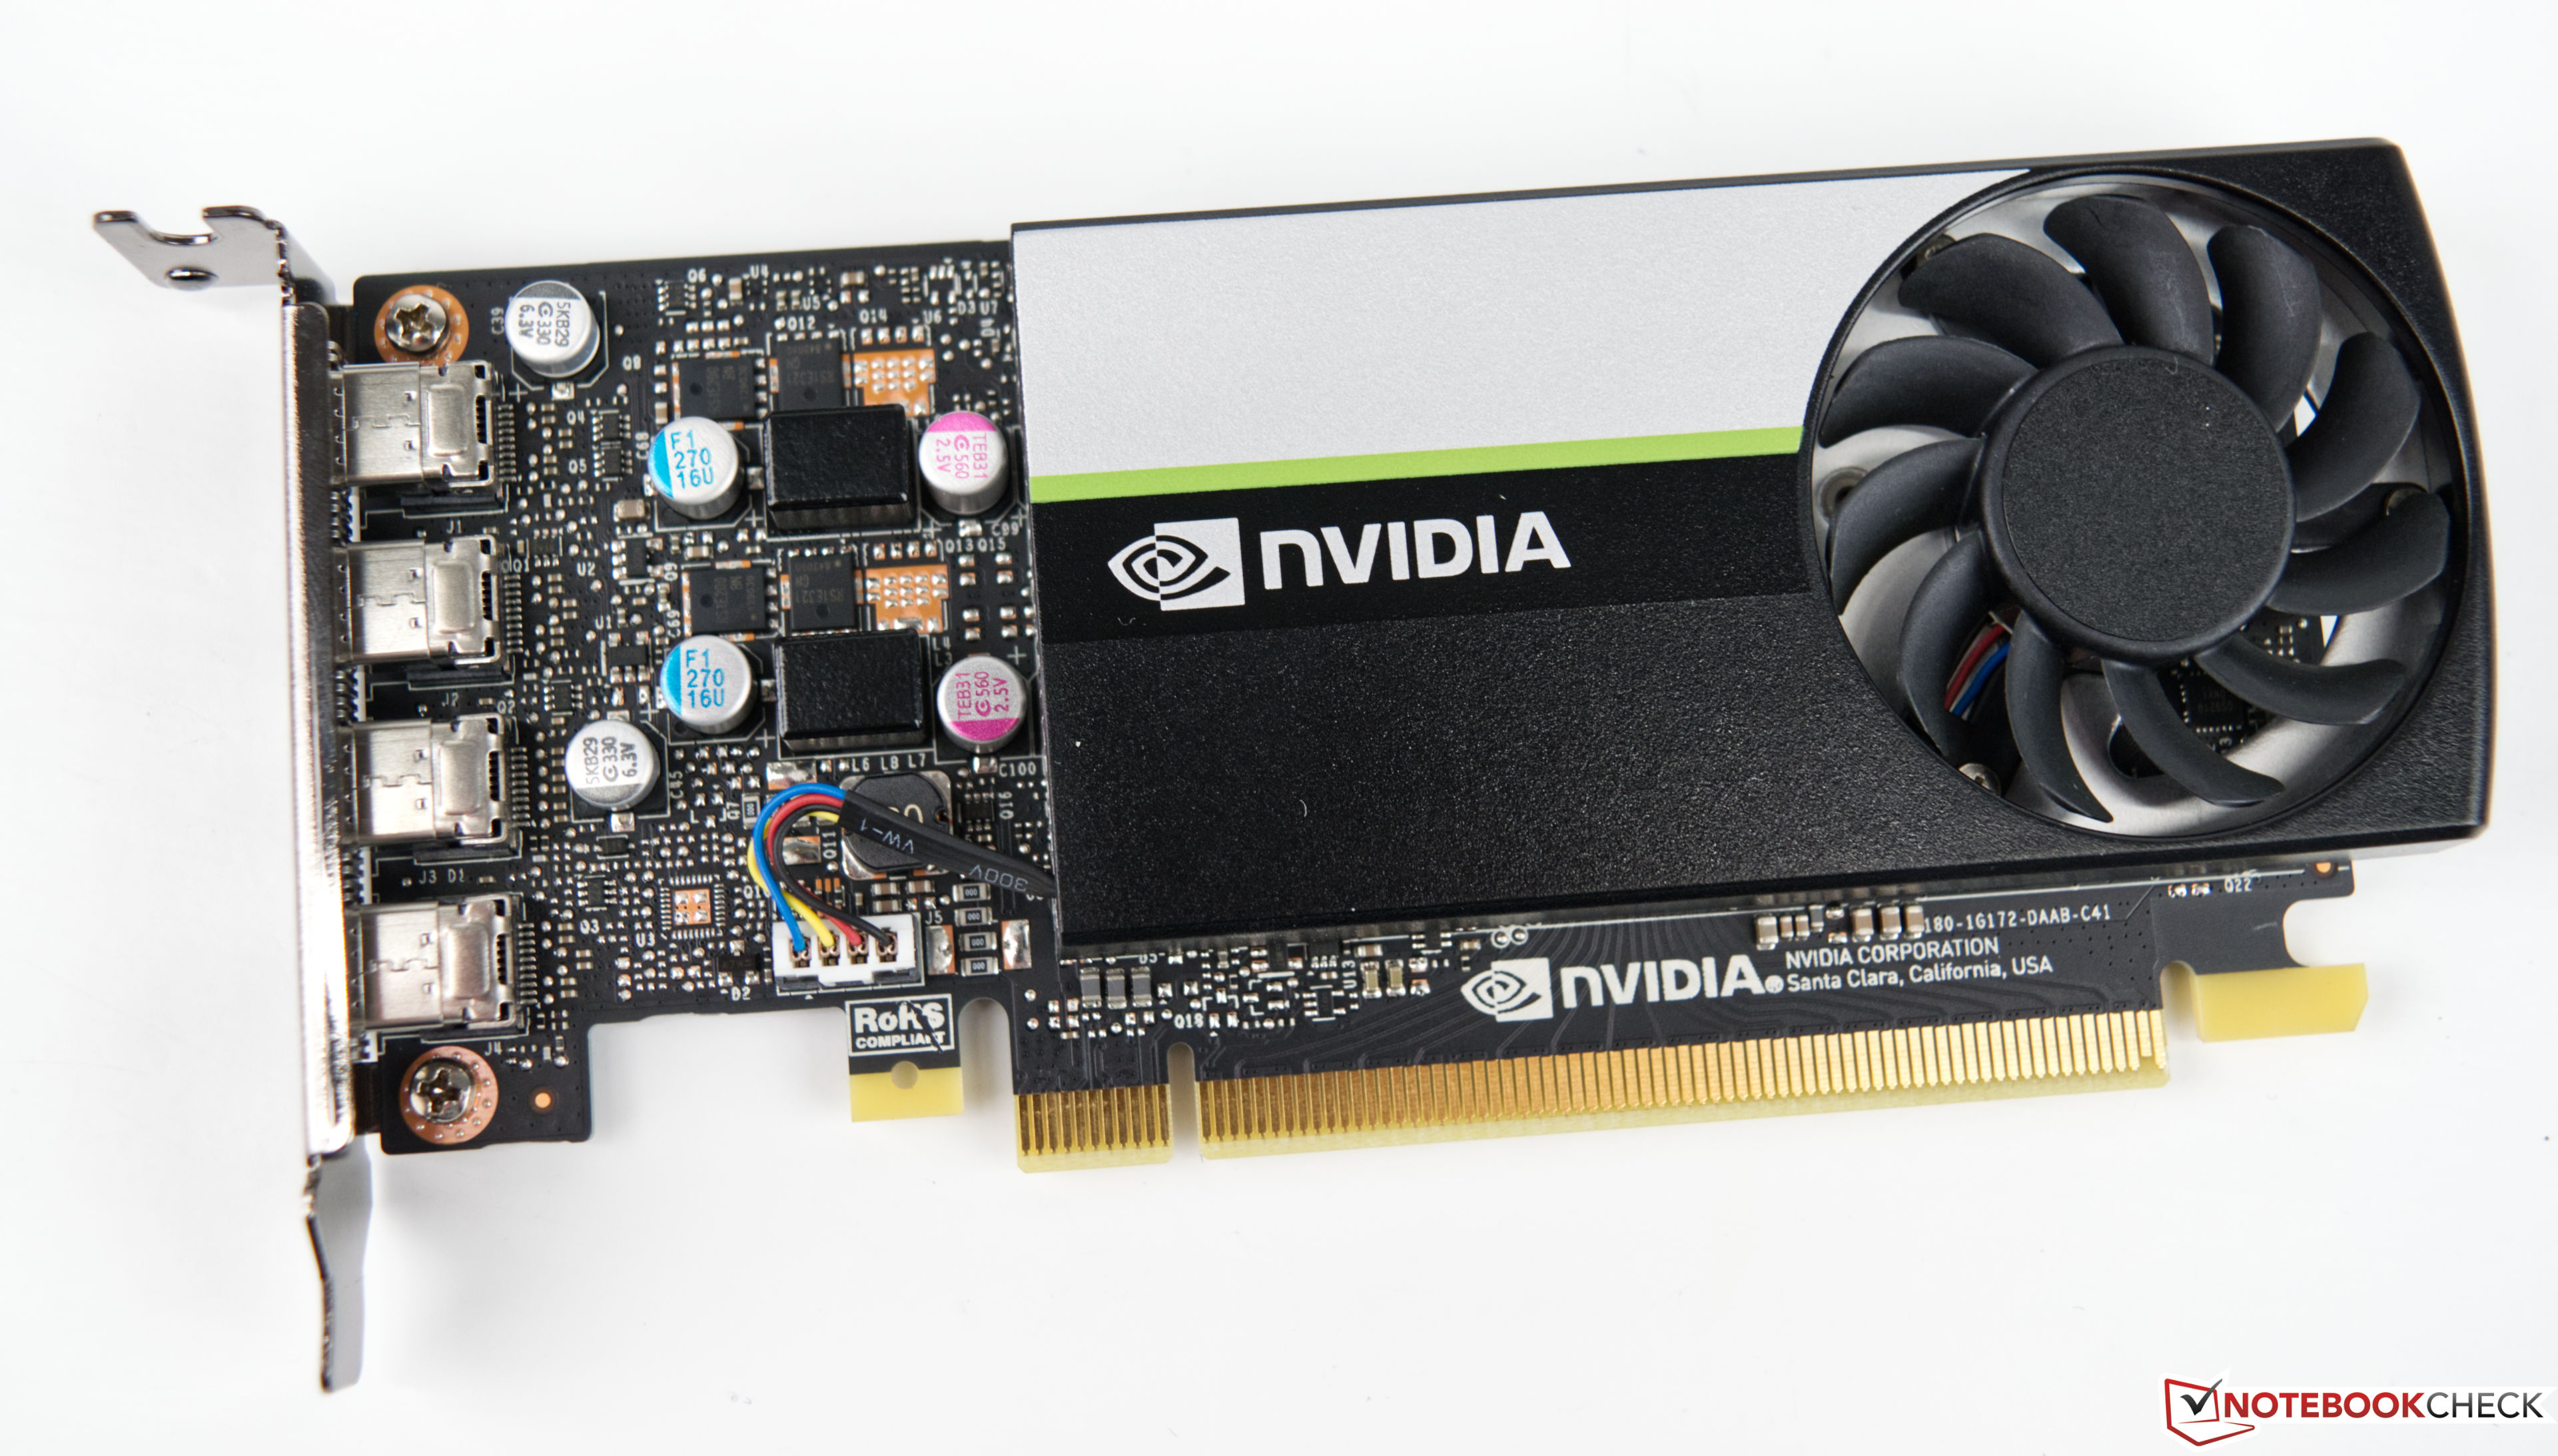
The Nvidia T600 Desktop GPU is a professional graphics card for workstations that is based on the Turing architecture (TU117 chip). The desktop version only offers 640 of the 1024 cores and therefore also less than the T600 mobile (896 CUDA cores). The card offers 4 GB GDDR6 graphics memory connected with a 128 bit bus (up to 160 GB/s bandwidth). The T600 supports certified drivers (former Quadro line) for professional applications like CAD, 3D modelling, DCC, medicine, or visualization applications.

The maximum power consumption of the card is rated at 40W.

NVIDIA T1000NVIDIA T600 Laptop GPUNVIDIA T600
Quadro Turing Series
Quadro RTX 6000 (Laptop) 4608 @ 1.28 - 1.46 GHz384 Bit @ 14000 MHz
Quadro RTX 5000 (Laptop) 3072 @ 1.04 - 1.55 GHz256 Bit @ 14000 MHz
Quadro RTX 5000 Max-Q 3072 @ 0.6 - 1.35 GHz256 Bit @ 14000 MHz
Quadro RTX 4000 (Laptop) 2560 @ 1.11 - 1.56 GHz256 Bit @ 14000 MHz
Quadro RTX 4000 Max-Q 2560 @ 0.78 - 1.38 GHz256 Bit @ 14000 MHz
Quadro RTX 3000 (Laptop) 1920 @ 0.95 - 1.38 GHz192 Bit @ 14000 MHz
Quadro RTX 3000 Max-Q 1920 @ 0.6 - 1.22 GHz192 Bit @ 14000 MHz
Quadro T2000 (Laptop) 1024 @ 1.58 - 1.79 GHz128 Bit @ 8000 MHz
Quadro T2000 Max-Q 1024 @ 0.93 - 1.5 GHz128 Bit @ 8000 MHz
Quadro T1000 (Laptop) 768 @ 1.4 - 1.46 GHz128 Bit @ 8000 MHz
T1000 896 @ 1.07 - 1.4 GHz128 Bit @ 10000 MHz
T1200 Laptop GPU 1024 @ 0.86 - 1.43 GHz128 Bit @ 10000 MHz
Quadro T1000 Max-Q 768 @ 0.8 - 1.46 GHz128 Bit @ 8000 MHz
T600 Laptop GPU 896 @ 1.4 GHz128 Bit @ 10000 MHz
T550 Laptop GPU 1024 @ 1.07 - 1.67 GHz64 Bit @ 12000 MHz
T500 Laptop GPU 896 @ 1.37 - 1.7 GHz64 Bit @ 10000 MHz
T600 640 @ 0.74 - 1.34 GHz128 Bit @ 10000 MHz
ArchitectureTuringTuringTuring
Pipelines896 - unified896 - unified640 - unified
TMUs5640
ROPs3232
Core Speed1065 - 1395 (Boost) MHz1400 (Boost) MHz735 - 1335 (Boost) MHz
Theoretical Performance5000 TFLOPS FP16, 2500 TFLOPS FP32, 0.7812 TFLOPS FP64
Memory Speed10000 effective = 1250 MHz10000 MHz10000 effective = 1250 MHz
Memory Bus Width128 Bit128 Bit128 Bit
Memory TypeGDDR6GDDR6GDDR6
Max. Amount of Memory8 GB4 GB4 GB
Shared Memorynonono
Memory Bandwidth160 GB/s160 GB/s
APIDirectX 12_1, Shader 6.8, OpenGL 4.6, OpenCL 3.0, Vulkan 1.3DirectX 12_1, OpenGL 4.6DirectX 12_1, Shader 6.6, OpenGL 4.6, OpenCL 3.0, Vulkan 1.3
Power Consumption50 Watt40 Watt40 Watt
Transistors4.7 Billion4.7 Billion
Die Size 200 mm² 200 mm²
technology12 nm12 nm12 nm
PCIe3.0 x163.0 x16
Displays4 Displays (max.), DisplayPort 1.4a4 Displays (max.), DisplayPort 4x mini-DisplayPort 1.4a
Date of Announcement06.05.2021 12.04.2021 12.04.2021
Features2.5 TFLOPS SP max. performance, DisplayPort 1.4, HDMI 2.0b, PCIe 4.0 x8, 160 GB/s memory bandwidth
Notebook Sizemedium sized
Link to Manufacturer Pagewww.nvidia.com

Benchmarks

Performance Rating - 3DMark 11 + Fire Strike + Time Spy - T1000
3.2 pt (9%)
Restrict / Search: Model: Max. age: years
Performance Rating - 3DMark 11 + Fire Strike + Time Spy - T600 Laptop GPU
3 pt (9%)
Restrict / Search: Model: Max. age: years
Performance Rating - 3DMark 11 + Fire Strike + Time Spy - T600
2.5 pt (7%)
Restrict / Search: Model: Max. age: years
3DMark - 3DMark Time Spy Score
3534 Points (9%)
3075 Points (8%)
2496 Points (7%)
3DMark - 3DMark Time Spy Graphics
3088 Points (6%)
2766 Points (6%)
2195 Points (4%)
3DMark - 3DMark Ice Storm Unlimited Graphics
100%
1 T1000 +
398761 Points (40%)
76%
1 T600 +
304731 Points (31%)
3DMark - 3DMark Ice Storm Extreme Graphics
100%
1 T1000 +
179865 Points (21%)
85%
1 T600 +
152912 Points (18%)
3DMark - 3DMark Cloud Gate Score
37881 Points (36%)
35278 Points (33%)
31922 Points (30%)
3DMark - 3DMark Cloud Gate Graphics
50553 Points (12%)
53941 Points (13%)
40917 Points (10%)
3DMark - 3DMark Fire Strike Standard Score
8124 Points (12%)
7475 Points (11%)
6284 Points (9%)
3DMark - 3DMark Fire Strike Standard Graphics
8450 Points (8%)
7928 Points (7%)
6552 Points (6%)
3DMark - 3DMark Ice Storm Graphics
237130 Points (26%)
75124 Points (8%)
182459 Points (20%)
3DMark - 3DMark Night Raid
100%
1 T1000 +
34584 Points (33%)
3DMark - 3DMark Night Raid Graphics Score
100%
1 T1000 +
41157 Points (16%)
3DMark 11 - 3DM11 Performance Score
12953 Points (16%)
10973 Points (13%)
9497 Points (11%)
3DMark 11 - 3DM11 Performance GPU
11793 Points (9%)
10498 Points (8%)
8694 Points (7%)
3DMark Vantage
3DM Vant. Perf. total + NVIDIA T1000
3DMark Vantage - 3DM Vant. Perf. total
46318 Points (13%)
3DM Vant. Perf. total + NVIDIA T600 Laptop GPU
39112 Points (11%)
3DM Vant. Perf. total + NVIDIA T600
745%
T600 +
344838 Points (100%)
3DM Vant. Perf. GPU no PhysX + NVIDIA T1000
3DMark Vantage - 3DM Vant. Perf. GPU no PhysX
39668 Points (22%)
3DM Vant. Perf. GPU no PhysX + NVIDIA T600 Laptop GPU
34680 Points (19%)
3DM Vant. Perf. GPU no PhysX + NVIDIA T600
30400 Points (17%)
3DMark 05 - 3DMark 05 - Standard
100%
1 T1000 +
78565 Points (86%)
59%
1 T600 +
46380 Points (51%)
3DMark 06 3DMark 06 - Standard 1280x1024 + NVIDIA T1000
3DMark 06
58968 Points (77%)
3DMark 06 - Standard 1280x1024 + NVIDIA T600 Laptop GPU
43438 Points (57%)
3DMark 06 - Standard 1280x1024 + NVIDIA T600
43997 Points (57%)
Unigine Valley 1.0 - Unigine Valley 1.0 DX
100%
1 T1000 +
42.2 fps (13%)
77%
1 T600 +
32.7 fps (10%)
Blender - Blender 3.3 Classroom CUDA *
100%
1 T1000 +
159 Seconds (24%)
Blender - Blender 3.3 Classroom OPTIX *
100%
1 T1000 +
159 Seconds (59%)
SPECviewperf 12
specvp12 sw-03 + NVIDIA T600
SPECviewperf 12 - specvp12 sw-03
100%
1 T600 +
115 fps (29%)
specvp12 snx-02 + NVIDIA T600
SPECviewperf 12 - specvp12 snx-02
100%
1 T600 +
68.6 fps (10%)
specvp12 showcase-01 + NVIDIA T600
SPECviewperf 12 - specvp12 showcase-01
100%
1 T600 +
35.3 fps (6%)
specvp12 mediacal-01 + NVIDIA T600
SPECviewperf 12 - specvp12 mediacal-01
100%
1 T600 +
19.5 fps (5%)
specvp12 maya-04 + NVIDIA T600
SPECviewperf 12 - specvp12 maya-04
100%
1 T600 +
67.4 fps (18%)
specvp12 energy-01 + NVIDIA T600
SPECviewperf 12 - specvp12 energy-01
100%
1 T600 +
5 fps (4%)
specvp12 creo-01 + NVIDIA T600
SPECviewperf 12 - specvp12 creo-01
100%
1 T600 +
78.5 fps (31%)
specvp12 catia-04 + NVIDIA T600
SPECviewperf 12 - specvp12 catia-04
100%
1 T600 +
76.9 fps (13%)
specvp12 3dsmax-05 + NVIDIA T600
SPECviewperf 12 - specvp12 3dsmax-05
100%
1 T600 +
80 fps (12%)
SPECviewperf 13 specvp13 sw-04 + NVIDIA T600 Laptop GPU
SPECviewperf 13 - specvp13 sw-04
106 fps (28%)
specvp13 sw-04 + NVIDIA T600
108%
1 T600 +
114 fps (31%)
specvp13 snx-03 + NVIDIA T600 Laptop GPU
SPECviewperf 13 - specvp13 snx-03
137 fps (15%)
specvp13 snx-03 + NVIDIA T600
89%
1 T600 +
122 fps (14%)
specvp13 showcase-02 + NVIDIA T600 Laptop GPU
SPECviewperf 13 - specvp13 showcase-02
41.4 fps (7%)
specvp13 showcase-02 + NVIDIA T600
84%
1 T600 +
34.9 fps (6%)
specvp13 medical-02 + NVIDIA T600 Laptop GPU
SPECviewperf 13 - specvp13 medical-02
42.6 fps (7%)
specvp13 medical-02 + NVIDIA T600
84%
1 T600 +
35.7 fps (6%)
specvp13 maya-05 + NVIDIA T600 Laptop GPU
SPECviewperf 13 - specvp13 maya-05
110 fps (12%)
specvp13 maya-05 + NVIDIA T600
91%
1 T600 +
99.8 fps (11%)
specvp13 energy-02 + NVIDIA T600 Laptop GPU
SPECviewperf 13 - specvp13 energy-02
16.1 fps (5%)
specvp13 energy-02 + NVIDIA T600
78%
1 T600 +
12.6 fps (4%)
specvp13 creo-02 + NVIDIA T600 Laptop GPU
SPECviewperf 13 - specvp13 creo-02
110 fps (16%)
specvp13 creo-02 + NVIDIA T600
89%
1 T600 +
98 fps (14%)
specvp13 catia-05 + NVIDIA T600 Laptop GPU
SPECviewperf 13 - specvp13 catia-05
130 fps (14%)
specvp13 3dsmax-06 + NVIDIA T600 Laptop GPU
SPECviewperf 13 - specvp13 3dsmax-06
89.8 fps (14%)
specvp13 3dsmax-06 + NVIDIA T600
89%
1 T600 +
79.9 fps (13%)
SPECviewperf 2020 specvp2020 medical-03 1080p + NVIDIA T1000
SPECviewperf 2020 - specvp2020 medical-03 1080p
100%
1 T1000 +
39.3 fps (11%)
specvp2020 medical-03 1080p + NVIDIA T600 Laptop GPU
18.7 fps (5%)
specvp2020 energy-03 1080p + NVIDIA T1000
SPECviewperf 2020 - specvp2020 energy-03 1080p
100%
1 T1000 +
18.1 fps (3%)
specvp2020 energy-03 1080p + NVIDIA T600 Laptop GPU
16 fps (3%)
specvp2020 creo-03 1080p + NVIDIA T1000
SPECviewperf 2020 - specvp2020 creo-03 1080p
100%
1 T1000 +
78.1 fps (27%)
specvp2020 creo-03 1080p + NVIDIA T600 Laptop GPU
67.3 fps (23%)
specvp2020 catia-06 1080p + NVIDIA T1000
SPECviewperf 2020 - specvp2020 catia-06 1080p
100%
1 T1000 +
37.3 fps (18%)
specvp2020 catia-06 1080p + NVIDIA T600 Laptop GPU
33.1 fps (16%)
specvp2020 3dsmax-07 1080p + NVIDIA T1000
SPECviewperf 2020 - specvp2020 3dsmax-07 1080p
100%
1 T1000 +
44 fps (12%)
specvp2020 3dsmax-07 1080p + NVIDIA T600 Laptop GPU
40.9 fps (11%)
specvp2020 medical-03 4k + NVIDIA T1000
SPECviewperf 2020 - specvp2020 medical-03 4k
100%
1 T1000 +
13.4 fps (9%)
specvp2020 medical-03 4k + NVIDIA T600
33%
1 T600 +
4.5 fps (3%)
specvp2020 maya-06 4k + NVIDIA T1000
SPECviewperf 2020 - specvp2020 maya-06 4k
100%
1 T1000 +
62.8 fps (9%)
specvp2020 maya-06 4k + NVIDIA T600
73%
1 T600 +
46.1 fps (7%)
specvp2020 energy-03 4k + NVIDIA T1000
SPECviewperf 2020 - specvp2020 energy-03 4k
100%
1 T1000 +
9.5 fps (1%)
specvp2020 energy-03 4k + NVIDIA T600
70%
1 T600 +
6.7 fps (1%)
specvp2020 creo-03 4k + NVIDIA T1000
SPECviewperf 2020 - specvp2020 creo-03 4k
100%
1 T1000 +
43.3 fps (19%)
specvp2020 creo-03 4k + NVIDIA T600
75%
1 T600 +
32.3 fps (14%)
specvp2020 catia-06 4k + NVIDIA T1000
SPECviewperf 2020 - specvp2020 catia-06 4k
100%
1 T1000 +
21.9 fps (14%)
specvp2020 catia-06 4k + NVIDIA T600
63%
1 T600 +
13.8 fps (9%)
specvp2020 3dsmax-07 4k + NVIDIA T1000
SPECviewperf 2020 - specvp2020 3dsmax-07 4k
100%
1 T1000 +
27.4 fps (9%)
specvp2020 3dsmax-07 4k + NVIDIA T600
71%
1 T600 +
19.4 fps (7%)
specvp2020 solidworks-05 1080p + NVIDIA T600 Laptop GPU
SPECviewperf 2020 - specvp2020 solidworks-05 1080p
73.4 fps (14%)
specvp2020 snx-04 1080p + NVIDIA T600 Laptop GPU
SPECviewperf 2020 - specvp2020 snx-04 1080p
136 fps (17%)
specvp2020 maya-06 1080p + NVIDIA T600 Laptop GPU
SPECviewperf 2020 - specvp2020 maya-06 1080p
125 fps (13%)
specvp2020 solidworks-05 4k + NVIDIA T600
SPECviewperf 2020 - specvp2020 solidworks-05 4k
100%
1 T600 +
16.9 fps (4%)
specvp2020 snx-04 4k + NVIDIA T600
SPECviewperf 2020 - specvp2020 snx-04 4k
100%
1 T600 +
75.6 fps (8%)
Cinebench R10 Cinebench R10 Shading (32bit) + NVIDIA T1000
Cinebench R10 - Cinebench R10 Shading (32bit)
100%
1 T1000 +
6837 Points (5%)
Cinebench R10 Shading (32bit) + NVIDIA T600
100%
1 T600 +
6830 Points (5%)
Cinebench R11.5 Cinebench R11.5 OpenGL 64 Bit + NVIDIA T1000
Cinebench R11.5 - Cinebench R11.5 OpenGL 64 Bit
252.5 fps (83%)
Cinebench R11.5 OpenGL 64 Bit + NVIDIA T600 Laptop GPU
162.3 fps (53%)
Cinebench R11.5 OpenGL 64 Bit + NVIDIA T600
104.1 fps (34%)
Cinebench R15
Cinebench R15 OpenGL 64 Bit + NVIDIA T1000
Cinebench R15 - Cinebench R15 OpenGL 64 Bit
335.8 fps (20%)
Cinebench R15 OpenGL 64 Bit + NVIDIA T600 Laptop GPU
268 fps (16%)
Cinebench R15 OpenGL 64 Bit + NVIDIA T600
227.1 fps (13%)
Cinebench R15 OpenGL Ref. Match 64 Bit + NVIDIA T1000
Cinebench R15 - Cinebench R15 OpenGL Ref. Match 64 Bit
99.6 % (100%)
Cinebench R15 OpenGL Ref. Match 64 Bit + NVIDIA T600 Laptop GPU
99.6 % (100%)
Cinebench R15 OpenGL Ref. Match 64 Bit + NVIDIA T600
100%
T600 +
99.6 % (100%)
GFXBench - GFXBench 5.0 Aztec Ruins High Tier Offscreen
62.7 fps (11%)
GFXBench - GFXBench 5.0 Aztec Ruins Normal Tier Offscreen
162.2 fps (12%)
GFXBench - GFXBench Car Chase Offscreen
156.5 fps (15%)
GFXBench (DX / GLBenchmark) 2.7
GFXBench T-Rex HD Offscreen C24Z16 + NVIDIA T600 Laptop GPU
GFXBench (DX / GLBenchmark) 2.7 - GFXBench T-Rex HD Offscreen C24Z16
585 fps (5%)
Basemark GPU 1.2 - Basemark GPU 1.2 Vulkan Official Medium Offscreen 1080
100%
1 T1000 +
386 fps (9%)
Basemark GPU 1.2 - Basemark GPU 1.2 Vulkan Official High Offscreen 2160
100%
1 T1000 +
31.9 fps (6%)
Geekbench 6.4 - Geekbench 6.4 GPU OpenCL
100%
1 T1000 +
38611 Points (10%)
Geekbench 6.4 - Geekbench 6.4 GPU Vulkan
100%
1 T1000 +
36031 Points (9%)
LuxMark v2.0 64Bit - LuxMark v2.0 Room GPU
1987 Samples/s (7%)
1166 Samples/s (4%)
1121 Samples/s (4%)
LuxMark v2.0 64Bit - LuxMark v2.0 Sala GPU
4129 Samples/s (7%)
2200 Samples/s (4%)
2049 Samples/s (4%)
ComputeMark v2.1 - ComputeMark v2.1 Result
6369 Points (5%)
5694 Points (5%)
4825 Points (4%)
Power Consumption - Furmark Stress Test Power Consumption - external Monitor *
100%
1 T1000 +
101.9 Watt (14%)
54.7 Watt (7%)
133%
1 T600 +
76.7 Watt (10%)
Power Consumption - The Witcher 3 Power Consumption - external Monitor *
60.6 Watt (8%)
73%
1 T600 +
83.5 Watt (12%)
Power Consumption - Witcher 3 Power Consumption *
62.3 Watt (14%)
Power Consumption - Power Efficiency - Witcher 3 ultra
0.4 fps per Watt (40%)
Power Consumption - Power Efficiency - Witcher 3 ultra external Monitor
0.5 fps per Watt (38%)
72%
1 T600 +
0.3 fps per Watt (27%)
Power Consumption - Cyberpunk 2077 Power Consumption - external Monitor *
100%
1 T1000 +
156.8 Watt (20%)
Power Consumption - Power Efficiency - Cyberpunk 2077 ultra
100%
1 T1000 +
0.1 fps per Watt (10%)
Emissions Witcher 3 Fan Noise + NVIDIA T600 Laptop GPU
Emissions - Witcher 3 Fan Noise
46.6 dB(A) (75%)

Average Benchmarks NVIDIA T1000 → 100% n=18

Average Benchmarks NVIDIA T600 Laptop GPU → 81% n=18

Average Benchmarks NVIDIA T600 → 110% n=18

- Range of benchmark values for this graphics card
red legend - Average benchmark values for this graphics card
* Smaller numbers mean a higher performance
1 This benchmark is not used for the average calculation

Game Benchmarks

The following benchmarks stem from our benchmarks of review laptops. The performance depends on the used graphics memory, clock rate, processor, system settings, drivers, and operating systems. So the results don't have to be representative for all laptops with this GPU. For detailed information on the benchmark results, click on the fps number.

F1 24

F1 24

2024
low 1920x1080
100%
T1000:
98.4  fps
med. 1920x1080
100%
T1000:
82.6  fps
high 1920x1080
100%
T1000:
58.8  fps
low 1920x1080
100%
T1000:
22  fps
med. 1920x1080
100%
T1000:
19  fps
high 1920x1080
100%
T1000:
15  fps
ultra 1920x1080
100%
T1000:
10  fps
low 1920x1080
100%
T1000:
138.6  fps
med. 1920x1080
100%
T1000:
90.8  fps
high 1920x1080
100%
T1000:
50.6  fps
ultra 1920x1080
100%
T1000:
39.8  fps
low 1920x1080
100%
T1000:
44  fps
med. 1920x1080
100%
T1000:
40  fps
high 1920x1080
100%
T1000:
38  fps
low 1920x1080
100%
T1000:
45.1  fps
med. 1920x1080
100%
T1000:
34.2  fps
high 1920x1080
100%
T1000:
28.3  fps
ultra 1920x1080
100%
T1000:
23.8  fps
low 1920x1080
100%
T1000:
45  fps
med. 1920x1080
100%
T1000:
35.2  fps
high 1920x1080
100%
T1000:
30.2  fps
ultra 1920x1080
100%
T1000:
29.5  fps
F1 23

F1 23

2023
low 1920x1080
100%
T1000:
108.3  fps
med. 1920x1080
100%
T1000:
96.5  fps
high 1920x1080
100%
T1000:
63.6  fps
low 1920x1080
T600 Laptop GPU:
119  fps
med. 1920x1080
T600 Laptop GPU:
64.5  fps
high 1920x1080
T600 Laptop GPU:
61.8  fps
ultra 1920x1080
T600 Laptop GPU:
60.1  fps
low 1920x1080
T600 Laptop GPU:
45.7  fps
med. 1920x1080
T600 Laptop GPU:
44.3  fps
high 1920x1080
T600 Laptop GPU:
43.9  fps
ultra 1920x1080
T600 Laptop GPU:
41.8  fps
low 1920x1080
100%
T1000:
69.2  fps
83%
T600 Laptop GPU:
57.5  fps
med. 1920x1080
100%
T1000:
55.6  fps
59%
T600 Laptop GPU:
32.8  fps
high 1920x1080
100%
T1000:
35.3  fps
137%
T600 Laptop GPU:
48.3  fps
ultra 1920x1080
100%
T1000:
27.6  fps
99%
T600 Laptop GPU:
27.2  fps
Elex 2

Elex 2

2022
low 1920x1080
T600 Laptop GPU:
38.5  fps
med. 1920x1080
T600 Laptop GPU:
35.7  fps
high 1920x1080
T600 Laptop GPU:
30.5  fps
ultra 1920x1080
T600 Laptop GPU:
26.9  fps
low 1920x1080
100%
T1000:
125.4  fps
83%
T600 Laptop GPU:
104.1  fps
med. 1920x1080
100%
T1000:
91.3  fps
78%
T600 Laptop GPU:
71  fps
high 1920x1080
100%
T1000:
69.6  fps
83%
T600 Laptop GPU:
57.7  fps
ultra 1920x1080
100%
T1000:
49.7  fps
84%
T600 Laptop GPU:
41.9  fps
low 1920x1080
T600 Laptop GPU:
52.4  fps
med. 1920x1080
T600 Laptop GPU:
45  fps
high 1920x1080
T600 Laptop GPU:
39  fps
ultra 1920x1080
T600 Laptop GPU:
29.9  fps
low 1920x1080
T600 Laptop GPU:
31.7  fps
med. 1920x1080
T600 Laptop GPU:
23  fps
high 1920x1080
T600 Laptop GPU:
18.3  fps
low 1920x1080
100%
T1000:
51.8  fps
med. 1920x1080
100%
T1000:
42.5  fps
high 1920x1080
100%
T1000:
33.5  fps
ultra 1920x1080
100%
T1000:
21.4  fps
low 1280x720
T600 Laptop GPU:
175.4  fps
med. 1920x1080
T600 Laptop GPU:
87.5  fps
high 1920x1080
T600 Laptop GPU:
63.5  fps
ultra 1920x1080
T600 Laptop GPU:
53.9  fps
low 1280x720
T600 Laptop GPU:
91  fps
med. 1920x1080
T600 Laptop GPU:
52  fps
high 1920x1080
T600 Laptop GPU:
39  fps
ultra 1920x1080
T600 Laptop GPU:
30  fps
Far Cry 6

Far Cry 6

2021
low 1280x720
100%
T1000:
110.4  fps
85%
T600:
93.5  fps
med. 1920x1080
100%
T1000:
56.9  fps
78%
T600:
44.6  fps
high 1920x1080
100%
T1000:
47.4  fps
45%
T600:
21.3  fps
ultra 1920x1080
100%
T1000:
40.3  fps
16%
T600:
6.3  fps
Deathloop

Deathloop

2021
low 1280x720
T600 Laptop GPU:
68.9  fps
med. 1920x1080
T600 Laptop GPU:
34.4  fps
high 1920x1080
T600 Laptop GPU:
28.4  fps
ultra 1920x1080
T600 Laptop GPU:
25.2  fps
F1 2021

F1 2021

2021
low 1280x720
T600:
171.9  fps
med. 1920x1080
T600:
78.8  fps
high 1920x1080
T600:
63.7  fps
ultra 1920x1080
T600:
40.2  fps
QHD 2560x1440
T600:
29.1  fps
4K 3840x2160
T600:
15.7  fps
low 1280x720
T600 Laptop GPU:
113.6  fps
med. 1920x1080
T600 Laptop GPU:
58.6  fps
high 1920x1080
T600 Laptop GPU:
52.1  fps
ultra 1920x1080
T600 Laptop GPU:
44  fps
low 1280x720
T600 Laptop GPU:
72  fps
med. 1920x1080
T600 Laptop GPU:
45  fps
high 1920x1080
T600 Laptop GPU:
36  fps
ultra 1920x1080
T600 Laptop GPU:
31  fps
low 1280x720
T600 Laptop GPU:
83.6  fps
med. 1920x1080
T600 Laptop GPU:
40.4  fps
high 1920x1080
T600 Laptop GPU:
34.9  fps
F1 2020

F1 2020

2020
low 1280x720
T600:
150.4  fps
med. 1920x1080
T600:
73.1  fps
high 1920x1080
T600:
55.5  fps
ultra 1920x1080
T600:
38.6  fps
QHD 2560x1440
T600:
27  fps
4K 3840x2160
T600:
14.5  fps
low 1280x720
100%
T1000:
151  fps
71%
T600:
107.6  fps
med. 1920x1080
100%
T1000:
60  fps
70%
T600:
42  fps
high 1920x1080
100%
T1000:
38.2  fps
70%
T600:
26.7  fps
ultra 1920x1080
100%
T1000:
28.6  fps
70%
T600:
19.9  fps
QHD 2560x1440
T600:
13.4  fps
4K 3840x2160
T600:
5.5  fps
low 1280x720
100%
T1000:
195.9  fps
med. 1920x1080
100%
T1000:
60  fps
high 1920x1080
100%
T1000:
37.3  fps
ultra 1920x1080
100%
T1000:
24.1  fps
low 1280x720
100%
T1000:
117  fps
med. 1920x1080
100%
T1000:
62  fps
high 1920x1080
100%
T1000:
58  fps
ultra 1920x1080
100%
T1000:
53  fps
low 1280x720
100%
T1000:
102.3  fps
73%
T600:
74.6  fps
med. 1920x1080
100%
T1000:
45.9  fps
74%
T600:
34  fps
high 1920x1080
100%
T1000:
33  fps
73%
T600:
24  fps
ultra 1920x1080
100%
T1000:
26.1  fps
74%
T600:
19.4  fps
QHD 2560x1440
T600:
14.8  fps
4K 3840x2160
T600:
8.5  fps
low 1280x720
T600 Laptop GPU:
98  fps
med. 1920x1080
T600 Laptop GPU:
53  fps
high 1920x1080
T600 Laptop GPU:
42  fps
ultra 1920x1080
T600 Laptop GPU:
36  fps
Strange Brigade

Strange Brigade

2018
low 1280x720
100%
T1000:
226  fps
84%
T600 Laptop GPU:
190.4  fps
77%
T600:
174.4  fps
med. 1920x1080
100%
T1000:
87.2  fps
87%
T600 Laptop GPU:
76.2  fps
74%
T600:
64.9  fps
high 1920x1080
100%
T1000:
69.4  fps
87%
T600 Laptop GPU:
60.7  fps
74%
T600:
51.4  fps
ultra 1920x1080
100%
T1000:
59.9  fps
88%
T600 Laptop GPU:
52.7  fps
75%
T600:
44.8  fps
QHD 2560x1440
T600:
31.9  fps
4K 3840x2160
T600:
17.9  fps
Far Cry 5

Far Cry 5

2018
low 1280x720
100%
T1000:
127  fps
83%
T600 Laptop GPU:
105  fps
75%
T600:
95  fps
med. 1920x1080
100%
T1000:
62  fps
85%
T600 Laptop GPU:
53  fps
74%
T600:
46  fps
high 1920x1080
100%
T1000:
57  fps
86%
T600 Laptop GPU:
49  fps
74%
T600:
42  fps
ultra 1920x1080
100%
T1000:
53  fps
85%
T600 Laptop GPU:
45  fps
74%
T600:
39  fps
QHD 2560x1440
T600:
26  fps
4K 3840x2160
T600:
12  fps
low 1280x720
100%
T1000:
211  fps
51%
T600 Laptop GPU:
107.9  fps
63%
T600:
132.8  fps
med. 1920x1080
100%
T1000:
145.8  fps
63%
T600 Laptop GPU:
92.4  fps
73%
T600:
107  fps
high 1920x1080
100%
T1000:
130.1  fps
59%
T600 Laptop GPU:
77  fps
74%
T600:
95.9  fps
4K 3840x2160
T600:
40.8  fps
low 1280x720
100%
T1000:
101.3  fps
85%
T600 Laptop GPU:
86  fps
70%
T600:
70.7  fps
med. 1920x1080
100%
T1000:
49.3  fps
89%
T600 Laptop GPU:
43.9  fps
71%
T600:
34.9  fps
high 1920x1080
100%
T1000:
36.2  fps
86%
T600 Laptop GPU:
31  fps
69%
T600:
25.1  fps
QHD 2560x1440
T600:
17.8  fps
4K 3840x2160
T600:
10  fps
low 1280x720
100%
T1000:
246.2  fps
61%
T600 Laptop GPU:
149.4  fps
66%
T600:
162.8  fps
med. 1366x768
100%
T1000:
217.7  fps
59%
T600 Laptop GPU:
127.6  fps
68%
T600:
148.6  fps
high 1920x1080
100%
T1000:
150.4  fps
77%
T600 Laptop GPU:
115.8  fps
80%
T600:
120.7  fps
ultra 1920x1080
100%
T1000:
136.5  fps
78%
T600 Laptop GPU:
107.1  fps
81%
T600:
110.5  fps
4K 3840x2160
T600:
39.6  fps
low 1024x768
100%
T1000:
188.8  fps
84%
T600 Laptop GPU:
158.6  fps
74%
T600:
139.1  fps
med. 1366x768
100%
T1000:
113.8  fps
81%
T600 Laptop GPU:
92.7  fps
73%
T600:
82.8  fps
high 1920x1080
100%
T1000:
63.9  fps
82%
T600 Laptop GPU:
52.2  fps
74%
T600:
47.5  fps
ultra 1920x1080
100%
T1000:
35.2  fps
78%
T600 Laptop GPU:
27.6  fps
77%
T600:
27.2  fps
4K 3840x2160
T600:
16.1  fps
GTA V

GTA V

2015
low 1024x768
100%
T1000:
187.4  fps
76%
T600 Laptop GPU:
142.6  fps
97%
T600:
181.5  fps
med. 1366x768
100%
T1000:
187.1  fps
74%
T600 Laptop GPU:
137.6  fps
94%
T600:
175.6  fps
high 1920x1080
100%
T1000:
103.5  fps
80%
T600 Laptop GPU:
82.3  fps
78%
T600:
80.3  fps
ultra 1920x1080
100%
T1000:
50.2  fps
88%
T600 Laptop GPU:
44.1  fps
76%
T600:
38.2  fps
QHD 2560x1440
T600:
26.6  fps
4K 3840x2160
T600:
25  fps

Average Gaming NVIDIA T1000 → 100%

Average Gaming 30-70 fps → 100%

Average Gaming NVIDIA T600 Laptop GPU → 81%

Average Gaming 30-70 fps → 87%

Average Gaming NVIDIA T600 → 72%

Average Gaming 30-70 fps → 74%

NVIDIA T1000NVIDIA T600 Laptop GPUNVIDIA T600
lowmed.highultraQHD4Klowmed.highultraQHD4Klowmed.highultraQHD4K
F1 2498.482.658.8
Avatar Frontiers of Pandora22191510
Total War Pharaoh138.690.850.639.8
Assassin's Creed Mirage444038
Cyberpunk 2077 2.2 Phantom Liberty45.134.228.323.8
Baldur's Gate 34535.230.229.5
F1 23108.396.563.6
Tiny Tina's Wonderlands69.255.635.327.657.532.848.327.2
GRID Legends125.491.369.649.7104.17157.741.9
God of War51.842.533.521.4
Far Cry 6110.456.947.440.393.544.621.36.33
Borderlands 31516038.228.6107.64226.719.913.45.54
Total War: Three Kingdoms195.96037.324.1
Far Cry New Dawn117625853
Metro Exodus102.345.93326.174.6342419.414.88.47
Strange Brigade22687.269.459.9190.476.260.752.7174.464.951.444.831.917.9
Far Cry 5127625753105534945954642392612
X-Plane 11.11211145.8130.1107.992.477132.810795.940.8
Final Fantasy XV Benchmark101.349.336.28643.93170.734.925.117.89.98
Dota 2 Reborn246.2217.7150.4136.5149.4127.6115.8107.1162.8148.6120.7110.539.6
The Witcher 3188.8113.863.935.2158.692.752.227.6139.182.847.527.216.1
GTA V187.4187.1103.550.2142.6137.682.344.1181.5175.680.338.226.625
NVIDIA T1000NVIDIA T600 Laptop GPUNVIDIA T600
lowmed.highultraQHD4Klowmed.highultraQHD4Klowmed.highultraQHD4K
< 30 fps
< 60 fps
< 120 fps
≥ 120 fps
1
4
7
10
1
8
10
3
2
13
5
2
8
8

1


< 30 fps
< 60 fps
< 120 fps
≥ 120 fps

1
4
4

3
4
2

5
4
2
4
1


< 30 fps
< 60 fps
< 120 fps
≥ 120 fps


5
5

5
3
2
4
3
2
1
4
3
1
5
1

7
2

For more games that might be playable and a list of all games and graphics cards visit our Gaming List

v1.33
log 25. 21:02:30

#0 ran 0s before starting gpusingle class +0s ... 0s

#1 checking url part for id 12782 +0s ... 0s

#2 checking url part for id 10685 +0s ... 0s

#3 checking url part for id 11373 +0s ... 0s

#4 not redirecting to Ajax server +0s ... 0s

#5 did not recreate cache, as it is less than 5 days old! Created at Fri, 25 Apr 2025 05:16:28 +0200 +0s ... 0s

#6 composed specs +0.004s ... 0.004s

#7 did output specs +0s ... 0.004s

#8 start showIntegratedCPUs +0s ... 0.004s

#9 getting avg benchmarks for device 12782 +0.011s ... 0.015s

#10 got single benchmarks 12782 +0s ... 0.015s

#11 getting avg benchmarks for device 10685 +0.003s ... 0.019s

#12 got single benchmarks 10685 +0.001s ... 0.02s

#13 getting avg benchmarks for device 11373 +0.004s ... 0.023s

#14 got single benchmarks 11373 +0s ... 0.024s

#15 got avg benchmarks for devices +0s ... 0.024s

#16 min, max, avg, median took s +0.033s ... 0.056s

#17 before gaming benchmark output +0s ... 0.056s

#18 Got 228 rows for game benchmarks. +0.01s ... 0.066s

#19 composed SQL query for gamebenchmarks +0s ... 0.066s

#20 got data and put it in $dataArray +0.002s ... 0.068s

#21 benchmarks composed for output. +0.012s ... 0.08s

#22 calculated avg scores. +0s ... 0.08s

#23 return log +0.001s ... 0.081s

Please share our article, every link counts!
Mail Logo
> Expert Reviews and News on Laptops, Smartphones and Tech Innovations > Benchmarks / Tech > Graphics Card Comparison - Head 2 Head
Redaktion, 2017-09- 8 (Update: 2023-07- 1)