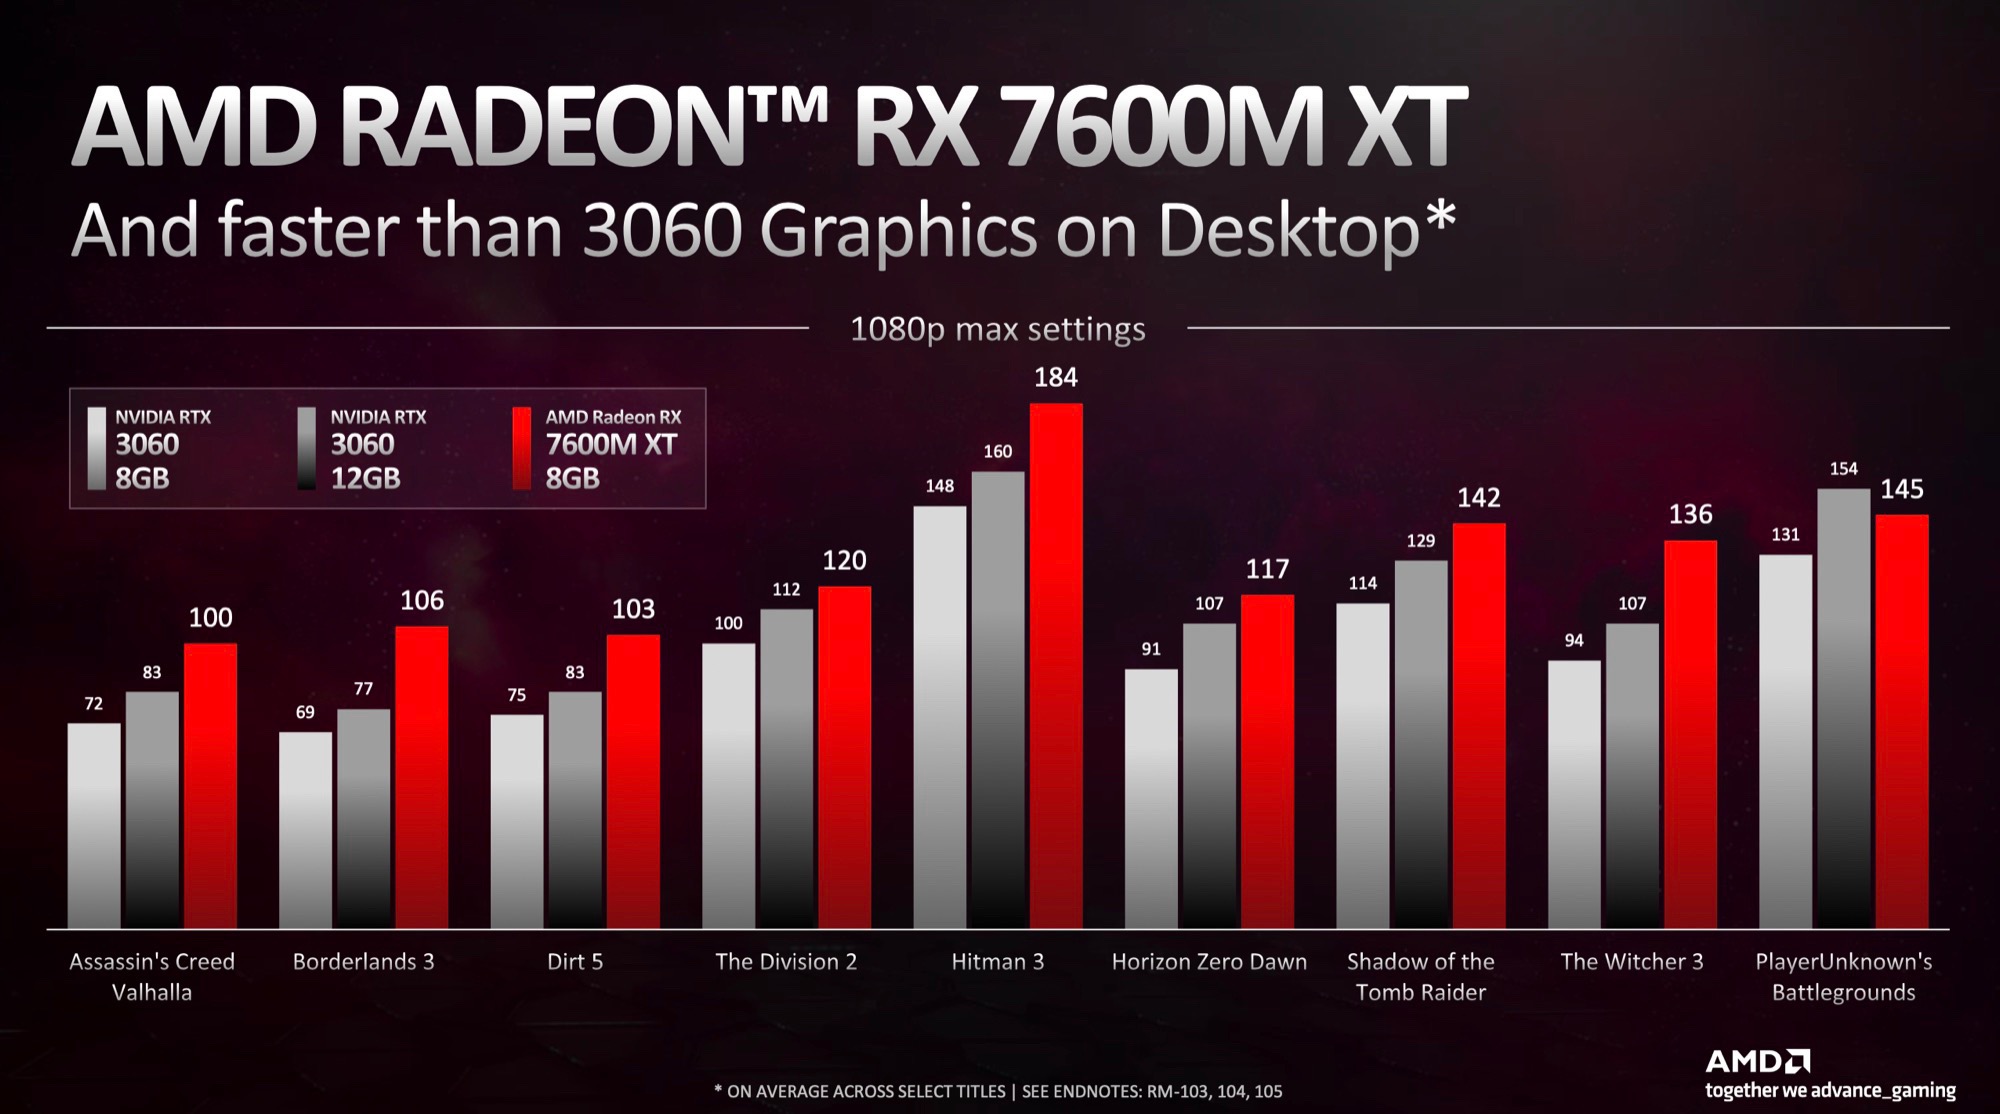
AMD Radeon RX 7600M XT ► remove from comparison The AMD Radeon RX 7600M XT is a mobile upper mid-range graphics card based on the Navi 33 chip (RDNA 3 architecture) manufactured in 6nm. It features 2,048 cores (32 CUs - compute units) and 8 GB of fast GDDR6 graphics memory connected with a 128 Bit memory bus. The chip also includes 32 MB Infinity Cache. The clock speed of the cores will depend on the laptop according to AMD. The specified game clock speed is 2300 MHz (most likely at 120 W TGP).
AMD compares the performance to the RTX 3060 desktop GPU and claims significantly faster frame rates in a couple of games (without Raytracing). Although the Raytracing performance did increase for RDNA 3, the GeForce GPUs are still faster in this regard.
The Navi 33 chip is manufactured at TSMC in the current 6nm process (versus 4nm of Nvidia RTX 4000 series). The power consumption (TGP) is specified at 75 to 120 Watt.
AMD Radeon RX 7900M ► remove from comparison The AMD Radeon RX 7900M is a mobile upper high-end graphics card based on the Navi 31 chip (RDNA 3 architecture) manufactured in 5nm. It features 4,608 cores (72 CUs - compute units) and 16 GB of fast GDDR6 graphics memory connected with a 256 Bit memory bus. The chip also includes 64 MB Infinity Cache. The clock speed of the cores will depend on the laptop according to AMD. The specified game clock speed is 1825 MHz (most likely at 180 W TGP).
AMD compares the performance to the mobile RTX 4080 and shows a number of games where the 7900M is on average 7% faster. Raytracing is supported in hardware, but usually slower than the Nvidia counterpart. Nvidia also has the advantage of DLSS support in selected games.
The Navi 31 chip is manufactured at TSMC in the current 5nm process. The power consumption (TGP) is specified at 160 to 180 Watt (200 Watt including SmartShift from the CPU).
AMD Radeon RX 7600M XT AMD Radeon RX 7900M Radeon RX 7000M Series Codename Navi 33 Navi 31 Architecture RDNA 3 RDNA 3 Pipelines 2048 - unified 4608 - unified ROPs 64 192 Core Speed 2300 (Boost) MHz 1825 - 2090 (Boost) MHz Theoretical Performance 42.8 TFLOPS FP16, 21.4 TFLOPS FP32 77.05 TFLOPS FP16, 38.52 TFLOPS FP32 Cache L3: 32 MB L3: 64 MB Memory Speed 18000 MHz 18000 MHz Memory Bus Width 128 Bit 256 Bit Memory Type GDDR6 GDDR6 Max. Amount of Memory 8 GB 16 GB Shared Memory no no Memory Bandwidth 288 GB/s 576 GB/s API DirectX 12, Shader 6.4, OpenGL 4.6 DirectX 12_2, Shader 6.7, OpenGL 4.6, OpenCL 2.2, Vulkan 1.3 Power Consumption 120 Watt (75 - 120 Watt TGP) 180 Watt (160 - 200 Watt TGP) Transistors 13.3 Billion 53.9 Billion Die Size 204 mm² technology 6 nm 5 nm Notebook Size large large Date of Announcement 05.01.2023 19.10.2023 Link to Manufacturer Page www.amd.com www.amd.com
Performance Rating - 3DMark 11 + Fire Strike + Time Spy - Radeon RX 7600M XT
3DMark - 3DMark Time Spy Score
min: 9246 avg: 9919 median: 9831 (26%) max: 11041 Points
GPU TDP ? TDP 120 W 99% 100%
GPU TDP ? TDP 120 W TDP 180 W 55% 55% 100%
3DMark - 3DMark Time Spy Graphics
min: 8966 avg: 9739 median: 9705.5 (20%) max: 10777 Points
GPU TDP ? TDP 120 W 99% 100%
GPU TDP ? TDP 120 W TDP 180 W 50% 50% 100%
3DMark - 3DMark Ice Storm Unlimited Graphics
min: 252549 avg: 466349 median: 494478 (50%) max: 606593 Points
GPU TDP ? TDP 120 W 82% 100%
3DMark - 3DMark Ice Storm Extreme Graphics
min: 172864 avg: 372224 median: 415193 (49%) max: 483319 Points
GPU TDP ? TDP 120 W 78% 100%
3DMark - 3DMark Cloud Gate Score
min: 36706 avg: 58320 median: 64091 (61%) max: 69632 Points
GPU TDP ? TDP 120 W 85% 100%
3DMark - 3DMark Cloud Gate Graphics
min: 136061 avg: 155465 median: 154102 (38%) max: 168736 Points
GPU TDP ? TDP 120 W 98% 100%
3DMark - 3DMark Fire Strike Standard Score
min: 19233 avg: 24992 median: 25834 (39%) max: 28539 Points
GPU TDP ? TDP 120 W TDP 130 W 96% 100% 73%
GPU TDP ? TDP 120 W TDP 130 W TDP 180 W 63% 65% 48% 100%
3DMark - 3DMark Fire Strike Standard Graphics
min: 22176 avg: 28242 median: 28688 (26%) max: 30684 Points
GPU TDP ? TDP 120 W TDP 130 W 100% 100% 76%
GPU TDP ? TDP 120 W TDP 130 W TDP 180 W 58% 58% 44% 100%
3DMark - 3DMark Ice Storm Graphics
min: 177869 avg: 412132 median: 470738 (52%) max: 547325 Points
GPU TDP ? TDP 120 W 77% 100%
3DMark - 3DMark Night Raid
min: 48750 avg: 59889 median: 61234.5 (58%) max: 66617 Points
GPU TDP ? TDP 120 W 93% 100%
3DMark - 3DMark Night Raid Graphics Score
min: 93268 avg: 108185 median: 112024 (43%) max: 121453 Points
GPU TDP ? TDP 120 W 96% 100%
3DMark 11 - 3DM11 Performance Score
min: 17827 avg: 29688 median: 32099 (39%) max: 35108 Points
GPU TDP ? TDP 120 W 84% 100%
GPU TDP ? TDP 120 W TDP 180 W 65% 78% 100%
3DMark 11 - 3DM11 Performance GPU
min: 27060 avg: 37792 median: 38690.5 (30%) max: 44060 Points
GPU TDP ? TDP 120 W 89% 100%
GPU TDP ? TDP 120 W TDP 180 W 59% 67% 100%
3DMark Vantage + AMD Radeon RX 7600M XT 3DMark Vantage - 3DM Vant. Perf. total
min: 78640 avg: 94908 median: 94691 (27%) max: 109040 Points
GPU TDP ? TDP 120 W 97% 100%
3DM Vant. Perf. GPU no PhysX + AMD Radeon RX 7600M XT 3DMark Vantage - 3DM Vant. Perf. GPU no PhysX
min: 84240 avg: 97889 median: 97707 (53%) max: 113597 Points
GPU TDP ? TDP 120 W 100% 100%
3DMark 05 - 3DMark 05 - Standard
min: 68064 avg: 69623 median: 68268 (75%) max: 72536 Points
GPU TDP ? TDP 120 W 97% 100%
3DMark 06 3DMark 06 - Standard 1366x768 + AMD Radeon RX 7600M XT 3DMark 06 - Standard 1280x1024 + AMD Radeon RX 7600M XT 3DMark 06
min: 14066 avg: 39380 median: 42560 (56%) max: 59090 Points
GPU TDP ? TDP 120 W 33% 100%
Unigine Valley 1.0 - Unigine Valley 1.0 DX
min: 91.6 avg: 97 median: 96.9 (29%) max: 101.1 fps
GPU TDP ? TDP 120 W 99% 100%
Blender - Blender 3.3 Classroom HIP *
min: 65 avg: 68 median: 68 (6%) max: 71 Seconds
SPECviewperf 12 + AMD Radeon RX 7600M XT SPECviewperf 12 - specvp12 sw-03
min: 175 avg: 209.7 median: 218 (54%) max: 243 fps
GPU TDP ? TDP 120 W 92% 100%
specvp12 snx-02 + AMD Radeon RX 7600M XT SPECviewperf 12 - specvp12 snx-02
min: 160 avg: 180.3 median: 186 (27%) max: 192 fps
GPU TDP ? TDP 120 W 94% 100%
specvp12 showcase-01 + AMD Radeon RX 7600M XT SPECviewperf 12 - specvp12 showcase-01
min: 91.5 avg: 115.4 median: 119 (21%) max: 125 fps
GPU TDP ? TDP 120 W 100% 89%
specvp12 mediacal-01 + AMD Radeon RX 7600M XT SPECviewperf 12 - specvp12 mediacal-01
min: 99 avg: 115 median: 111.5 (28%) max: 136 fps
GPU TDP ? TDP 120 W 100% 96%
specvp12 maya-04 + AMD Radeon RX 7600M XT SPECviewperf 12 - specvp12 maya-04
min: 155 avg: 193 median: 201.5 (55%) max: 226 fps
GPU TDP ? TDP 120 W 94% 100%
specvp12 energy-01 + AMD Radeon RX 7600M XT SPECviewperf 12 - specvp12 energy-01
min: 20.4 avg: 28.2 median: 24.9 (22%) max: 39.2 fps
GPU TDP ? TDP 120 W 100% 83%
specvp12 creo-01 + AMD Radeon RX 7600M XT SPECviewperf 12 - specvp12 creo-01
min: 73.1 avg: 87.9 median: 87 (35%) max: 110 fps
GPU TDP ? TDP 120 W 100% 98%
specvp12 catia-04 + AMD Radeon RX 7600M XT SPECviewperf 12 - specvp12 catia-04
min: 176 avg: 216.7 median: 229.5 (38%) max: 251 fps
GPU TDP ? TDP 120 W 91% 100%
specvp12 3dsmax-05 + AMD Radeon RX 7600M XT SPECviewperf 12 - specvp12 3dsmax-05
min: 105 avg: 196.3 median: 205.5 (31%) max: 295 fps
GPU TDP ? TDP 120 W 93% 100%
SPECviewperf 13 specvp13 sw-04 + AMD Radeon RX 7600M XT SPECviewperf 13 - specvp13 sw-04
min: 176 avg: 200.3 median: 207 (55%) max: 223 fps
GPU TDP ? TDP 120 W 94% 100%
specvp13 snx-03 + AMD Radeon RX 7600M XT SPECviewperf 13 - specvp13 snx-03
min: 286 avg: 324.8 median: 335.5 (37%) max: 348 fps
GPU TDP ? TDP 120 W 95% 100%
specvp13 showcase-02 + AMD Radeon RX 7600M XT SPECviewperf 13 - specvp13 showcase-02
min: 91.6 avg: 115.4 median: 119 (20%) max: 125 fps
GPU TDP ? TDP 120 W 100% 89%
specvp13 medical-02 + AMD Radeon RX 7600M XT SPECviewperf 13 - specvp13 medical-02
min: 163 avg: 183.8 median: 192 (33%) max: 198 fps
GPU TDP ? TDP 120 W 94% 100%
specvp13 maya-05 + AMD Radeon RX 7600M XT SPECviewperf 13 - specvp13 maya-05
min: 255 avg: 304.5 median: 319.5 (36%) max: 340 fps
GPU TDP ? TDP 120 W 93% 100%
specvp13 energy-02 + AMD Radeon RX 7600M XT SPECviewperf 13 - specvp13 energy-02
min: 70.4 avg: 73.2 median: 72 (23%) max: 81.1 fps
GPU TDP ? TDP 120 W 100% 99%
specvp13 creo-02 + AMD Radeon RX 7600M XT SPECviewperf 13 - specvp13 creo-02
min: 175 avg: 232.2 median: 249 (36%) max: 275 fps
GPU TDP ? TDP 120 W 89% 100%
specvp13 catia-05 + AMD Radeon RX 7600M XT SPECviewperf 13 - specvp13 catia-05
min: 273 avg: 329.3 median: 347.5 (39%) max: 380 fps
GPU TDP ? TDP 120 W 92% 100%
specvp13 3dsmax-06 + AMD Radeon RX 7600M XT SPECviewperf 13 - specvp13 3dsmax-06
min: 104 avg: 196.5 median: 207.5 (32%) max: 294 fps
GPU TDP ? TDP 120 W 92% 100%
SPECviewperf 2020 specvp2020 snx-04 1080p + AMD Radeon RX 7600M XT SPECviewperf 2020 - specvp2020 snx-04 1080p
min: 327 avg: 334.7 median: 331 (40%) max: 346 fps
GPU TDP ? TDP 120 W 100% 95%
specvp2020 medical-03 1080p + AMD Radeon RX 7600M XT SPECviewperf 2020 - specvp2020 medical-03 1080p
min: 82.9 avg: 86 median: 86 (24%) max: 89 fps
GPU TDP ? TDP 120 W 100% 95%
specvp2020 maya-06 1080p + AMD Radeon RX 7600M XT SPECviewperf 2020 - specvp2020 maya-06 1080p
min: 411 avg: 425.7 median: 412 (44%) max: 454 fps
GPU TDP ? TDP 120 W 100% 91%
specvp2020 energy-03 1080p + AMD Radeon RX 7600M XT SPECviewperf 2020 - specvp2020 energy-03 1080p
min: 72 avg: 76.2 median: 74.9 (12%) max: 81.6 fps
GPU TDP ? TDP 120 W 100% 90%
specvp2020 creo-03 1080p + AMD Radeon RX 7600M XT SPECviewperf 2020 - specvp2020 creo-03 1080p
min: 144 avg: 151.7 median: 152 (52%) max: 159 fps
GPU TDP ? TDP 120 W 100% 93%
specvp2020 catia-06 1080p + AMD Radeon RX 7600M XT SPECviewperf 2020 - specvp2020 catia-06 1080p
min: 95.9 avg: 97.4 median: 97.2 (47%) max: 99.2 fps
GPU TDP ? TDP 120 W 100% 97%
specvp2020 3dsmax-07 1080p + AMD Radeon RX 7600M XT SPECviewperf 2020 - specvp2020 3dsmax-07 1080p
min: 110 avg: 117.3 median: 113 (30%) max: 129 fps
GPU TDP ? TDP 120 W 100% 86%
specvp2020 solidworks-05 4k + AMD Radeon RX 7600M XT SPECviewperf 2020 - specvp2020 solidworks-05 4k
min: 43.7 avg: 85 median: 98.4 (24%) max: 99.5 fps
GPU TDP ? TDP 120 W 81% 100%
specvp2020 snx-04 4k + AMD Radeon RX 7600M XT SPECviewperf 2020 - specvp2020 snx-04 4k
min: 67 avg: 194 median: 211 (22%) max: 220 fps
GPU TDP ? TDP 120 W 83% 100%
specvp2020 medical-03 4k + AMD Radeon RX 7600M XT SPECviewperf 2020 - specvp2020 medical-03 4k
min: 17.9 avg: 27.5 median: 28.9 (18%) max: 32.1 fps
GPU TDP ? TDP 120 W 89% 100%
specvp2020 maya-06 4k + AMD Radeon RX 7600M XT SPECviewperf 2020 - specvp2020 maya-06 4k
min: 60.1 avg: 145.9 median: 161.5 (23%) max: 171 fps
GPU TDP ? TDP 120 W 82% 100%
specvp2020 energy-03 4k + AMD Radeon RX 7600M XT SPECviewperf 2020 - specvp2020 energy-03 4k
min: 24.7 avg: 54.2 median: 49.4 (7%) max: 90.5 fps
GPU TDP ? TDP 120 W 79% 100%
specvp2020 creo-03 4k + AMD Radeon RX 7600M XT SPECviewperf 2020 - specvp2020 creo-03 4k
min: 34.3 avg: 79.4 median: 88.6 (40%) max: 97.5 fps
GPU TDP ? TDP 120 W 78% 100%
specvp2020 catia-06 4k + AMD Radeon RX 7600M XT SPECviewperf 2020 - specvp2020 catia-06 4k
min: 34.9 avg: 58.8 median: 62.8 (41%) max: 64.5 fps
GPU TDP ? TDP 120 W 87% 100%
specvp2020 3dsmax-07 4k + AMD Radeon RX 7600M XT SPECviewperf 2020 - specvp2020 3dsmax-07 4k
min: 25.3 avg: 51.7 median: 57.7 (19%) max: 63.9 fps
GPU TDP ? TDP 120 W 79% 100%
Cinebench R10 Cinebench R10 Shading (32bit) + AMD Radeon RX 7600M XT Cinebench R10 - Cinebench R10 Shading (32bit)
Cinebench R15 + AMD Radeon RX 7600M XT Cinebench R15 - Cinebench R15 OpenGL 64 Bit
min: 38.16 avg: 227.5 median: 227.5 (13%) max: 416.92 fps
GPU TDP ? TDP 130 W 100% 9%
Cinebench R15 OpenGL 64 Bit + AMD Radeon RX 7900M GPU TDP ? TDP 130 W TDP 180 W 100% 9% 89%
Cinebench R15 OpenGL Ref. Match 64 Bit + AMD Radeon RX 7600M XT Cinebench R15 - Cinebench R15 OpenGL Ref. Match 64 Bit
min: 97.9 avg: 98 median: 98 (98%) max: 98 %
GPU TDP ? TDP 130 W 100% 100%
Cinebench R15 OpenGL Ref. Match 64 Bit + AMD Radeon RX 7900M GPU TDP ? TDP 130 W TDP 180 W 100% 100% 100%
Basemark GPU 1.2 - Basemark GPU 1.2 Vulkan Official Medium Offscreen 1080
min: 104.6 avg: 299.5 median: 104.6 (3%) max: 971 fps
GPU TDP ? TDP 120 W TDP 130 W 29% 100% 11%
GPU TDP ? TDP 120 W TDP 130 W TDP 180 W 29% 100% 11% 11%
Basemark GPU 1.2 - Basemark GPU 1.2 Vulkan Official High Offscreen 2160
min: 3.64 avg: 34 median: 3.6 (1%) max: 84.2 fps
GPU TDP ? TDP 120 W 25% 100%
GPU TDP ? TDP 120 W TDP 180 W 25% 100% 4%
Geekbench 6.4 - Geekbench 6.4 GPU OpenCL
min: 68792 avg: 73438 median: 72513.5 (19%) max: 79934 Points
GPU TDP ? TDP 120 W 100% 100%
GPU TDP ? TDP 120 W TDP 180 W 52% 52% 100%
Geekbench 6.4 - Geekbench 6.4 GPU Vulkan
min: 73351 avg: 82307 median: 83067 (21%) max: 90252 Points
GPU TDP ? TDP 120 W TDP 130 W 87% 96% 100%
GPU TDP ? TDP 120 W TDP 130 W TDP 180 W 57% 62% 65% 100%
LuxMark v2.0 64Bit - LuxMark v2.0 Room GPU
min: 1892 avg: 3008 median: 2782 (10%) max: 4693 Samples/s
GPU TDP ? TDP 120 W 90% 100%
LuxMark v2.0 64Bit - LuxMark v2.0 Sala GPU
min: 4244 avg: 6618 median: 6485 (11%) max: 9811 Samples/s
GPU TDP ? TDP 120 W 89% 100%
ComputeMark v2.1 - ComputeMark v2.1 Result
min: 20214 avg: 21442 median: 21247 (18%) max: 24186 Points
GPU TDP ? TDP 120 W 100% 97%
Power Consumption - Furmark Stress Test Power Consumption - external Monitor *
min: 134.7 avg: 199.7 median: 194.4 (26%) max: 259 Watt
GPU TDP ? TDP 120 W TDP 130 W 101% 100% 100%
GPU TDP ? TDP 120 W TDP 130 W TDP 180 W 127% 126% 126% 100%
Power Consumption - The Witcher 3 Power Consumption - external Monitor *
min: 135.6 avg: 206.2 median: 222 (31%) max: 261 Watt
GPU TDP ? TDP 120 W TDP 130 W 128% 100% 109%
GPU TDP ? TDP 120 W TDP 130 W TDP 180 W 128% 100% 109% 121%
Power Consumption - Witcher 3 Power Consumption *
GPU TDP 130 W TDP 180 W 100% 105%
Power Consumption - Power Efficiency - Witcher 3 ultra
Power Consumption - Power Efficiency - Witcher 3 ultra external Monitor
min: 0.3793 avg: 0.5 median: 0.4 (32%) max: 0.791 fps per Watt
GPU TDP ? TDP 120 W TDP 130 W 100% 49% 48%
Power Consumption - Cyberpunk 2077 Power Consumption - external Monitor *
min: 206 avg: 236.7 median: 222 (28%) max: 282 Watt
GPU TDP ? TDP 120 W 100% 113%
Emissions Witcher 3 Fan Noise + AMD Radeon RX 7600M XT Emissions - Witcher 3 Fan Noise
Model CPU GPU RAM Value GPD G1 Radeon RX 7600M XT (OCuLink @PCIe x4 4.0) R7 7840HS 65 W / 65 W Radeon RX 7600M XT 2469 / 2250 MHz 8 GB 32 GB 57.5
Witcher 3 Fan Noise + AMD Radeon RX 7900M GPU TDP ? TDP 180 W 100% 93%
Average Benchmarks AMD Radeon RX 7600M XT → 100% n=12 Average Benchmarks AMD Radeon RX 7900M → 152% n=12
- Range of benchmark values for this graphics card
- Average benchmark values for this graphics card
* Smaller numbers mean a higher performance
1 This benchmark is not used for the average calculation
The following benchmarks stem from our benchmarks of review laptops. The performance depends on the used graphics memory, clock rate, processor, system settings, drivers, and operating systems. So the results don't have to be representative for all laptops with this GPU. For detailed information on the benchmark results, click on the fps number.
AMD Radeon RX 7600M XT AMD Radeon RX 7900M low med. high ultra QHD 4K low med. high ultra QHD 4K Call of Duty Black Ops 6 143 129 82 77 60 35 God of War Ragnarök 120.1 105.5 90.8 52.1 5.8 Final Fantasy XVI 62.1 59.9 53.3 54.4 48.7 23 Space Marine 2 67.8 67.2 65.6 63.3 45.2 Star Wars Outlaws 43.5 38.8 35 28.2 19.5 Black Myth: Wukong 83 60 46 24 17 6 Once Human 181.8 121.6 99.1 88.9 55.7 25.3 The First Descendant 155 100 89 74 44 21 F1 24 294 246 138 29 13 11 Senua's Saga Hellblade 2 63.8 53.8 17.8 10.7 Ghost of Tsushima 121.9 99.2 90.3 65.6 46.1 25.1 Horizon Forbidden West 107.3 89.6 61 57 46 26.6 Alone in the Dark 196.9 167 84.2 50.3 8.2 Dragon's Dogma 2 78.9 72.1 50.2 26.8 Last Epoch 228 180.2 154.8 118 71.3 32.7 Skull & Bones 139 125 96 70 52 28 Helldivers 2 143.5 111 97 94.7 45.3 22.7 Enshrouded 66.1 46.1 26.7 15.2 14 Palworld 174 151.9 94.2 82.7 57.9 30.8 Prince of Persia The Lost Crown 356 358 358 350 170.8 Ready or Not 172.9 155.3 150.4 100.2 76.7 33.3 The Finals 293 216 169 129 77 36.6 Avatar Frontiers of Pandora 60 55 42 32 22 10 Call of Duty Modern Warfare 3 2023 183 163 113 103 71 43 EA Sports WRC 146 98 88 79 57 31 Alan Wake 2 76 66 60 35 15 104.8 71.7 37.3 Lords of the Fallen 89 79 61 45 30 13 Total War Pharaoh 331 210 129 102 70 35 Assassin's Creed Mirage 123 111 98 67 51 28 EA Sports FC 24 202 172.2 142.7 128.3 105.3 68.7 Counter-Strike 2 331 317 199 130 84 41 Cyberpunk 2077 2.2 Phantom Liberty 117 94 80 72 43 19 130.7 129.6 85.2 37.7 Baldur's Gate 3 133 106 91 88 61 31 152.4 152.6 118.5 65.8 Lies of P 167 143 125 113 78 39 Starfield 75 67 55 50 41 26 Armored Core 6 116 99 92 71 70 36 Immortals of Aveum 77 67 51 30 11 Atlas Fallen 145 138 125 101 70 24 Ratchet & Clank Rift Apart 44 36 25 22 18 12 86.2 83.6 54.8 F1 23 221 206 158 32 15 6 Diablo 4 229 228 185 152 92 48 Star Wars Jedi Survivor 83 73 69 64 39 18 Dead Island 2 260 224 168 119 82 41 The Last of Us 93 76 63 46 31 7 Resident Evil 4 Remake 145 109 93 60 46 15 Company of Heroes 3 173 152 116 114 84 49 Sons of the Forest 106 99 93 92 69 37 Atomic Heart 186 140 85 64 49 28 Returnal 107 100 90 76 56 30 Hogwarts Legacy 146 111 85 65 43 23 Dead Space Remake 80 71 65 70 43 13 The Witcher 3 v4.00 216 184 131 106 71 38 High On Life 278 168 156 105 60 22 The Callisto Protocol 185 134 119 78 59 34 Need for Speed Unbound 141 122 93 79 57 26 Spider-Man Miles Morales 114.7 101.1 94.4 84.3 36.3 20.7 Uncharted Legacy of Thieves Collection 77 74 68 65 42 11 A Plague Tale Requiem 110 83 61 46 30 18.4 The Quarry 155 115 94 70 41 14 F1 22 221 203 158 45 28 10 296 102.8 69.3 36.1 Ghostwire Tokyo 174 159 157 156 93 43 Tiny Tina's Wonderlands 210 163 105 83 57 20 150.2 106.8 56 Cyberpunk 2077 1.6 115.9 95.6 81 74.3 47.6 21.7 135 93.3 44.3 GRID Legends 163 137 116 102 88 57 God of War 125 112 93 67 53 34 Farming Simulator 22 356 244 196 172 136 85 Forza Horizon 5 243 194 180 72 57 35 Guardians of the Galaxy 167 142 135 104 87 62 Far Cry 6 156 134 119 94 66 4 F1 2021 357 270 199 90 65 27 Assassin´s Creed Valhalla 222 139 114 92 67 30 Dirt 5 102 81 63 53 53 52 Watch Dogs Legion 147 142 128 60 41 22 Horizon Zero Dawn 185 140 122 106 81 44 Death Stranding 195 141 136 134 99 54 F1 2020 342 219 179 123 95 56 Borderlands 3 149 120 97 81 59 31 Control 238 122 90 58 29 Total War: Three Kingdoms 352 203 127 87 52 24 Anno 1800 137 128 110 54 48 34 The Division 2 194 184 144 103 67 29 Far Cry New Dawn 127 107 103 92 85 55 Metro Exodus 215 105 84 67 52 31 Apex Legends 144 144 143.9 139.6 124.4 98.8 Assassin´s Creed Odyssey 142 131 119 85 62 32 Forza Horizon 4 290 245 237 180 142 90 Shadow of the Tomb Raider 222 146 137 117 76 33 207 198 139 76 Strange Brigade 420 223 188 164 118 60 344 249 130.5 Far Cry 5 145 127 124 115 95 51 128 123 103 X-Plane 11.11 107 83 64 46 83.7 64.3 Final Fantasy XV Benchmark 217 132 90 66 36 152.8 114.6 69.3 Assassin´s Creed Origins 136 97 93 78 62 39 Rise of the Tomb Raider 280 199.4 128.1 108.3 49.3 Dota 2 Reborn 173 142 133 113 83 162.8 146.2 122.5 The Witcher 3 384 283 168 101 75 52 167.7 116 GTA V 174 169 157 89 68 71 172.9 105 105.6 146 AMD Radeon RX 7600M XT AMD Radeon RX 7900M low med. high ultra QHD 4K low med. high ultra QHD 4K < 30 fps < 60 fps < 120 fps ≥ 120 fps 2 25 68 6 33 54 3 5 51 37 5 13 60 12 10 42 37 4 42 40 8 1 < 30 fps < 60 fps < 120 fps ≥ 120 fps 2 7 3 9 9 3 6 6 3
log 03. 04:09:09
#0 ran 0s before starting gpusingle class +0s ... 0s
#1 checking url part for id 11550 +0s ... 0s
#2 checking url part for id 11620 +0s ... 0s
#3 not redirecting to Ajax server +0s ... 0s
#4 did not recreate cache, as it is less than 5 days old! Created at Tue, 01 Jul 2025 05:20:42 +0200 +0s ... 0s
#5 composed specs +0.018s ... 0.018s
#6 did output specs +0s ... 0.018s
#7 start showIntegratedCPUs +0s ... 0.018s
#8 getting avg benchmarks for device 11550 +0.019s ... 0.037s
#9 got single benchmarks 11550 +0.015s ... 0.052s
#10 getting avg benchmarks for device 11620 +0s ... 0.052s
#11 got single benchmarks 11620 +0.003s ... 0.056s
#12 got avg benchmarks for devices +0s ... 0.056s
#13 min, max, avg, median took s +0.043s ... 0.099s
#14 before gaming benchmark output +0s ... 0.099s
#15 Got 1679 rows for game benchmarks. +0.048s ... 0.147s
#16 composed SQL query for gamebenchmarks +0s ... 0.147s
#17 got data and put it in $dataArray +0.008s ... 0.155s
#18 benchmarks composed for output. +0.037s ... 0.193s
#19 calculated avg scores. +0s ... 0.193s
#20 return log +0.003s ... 0.195s