Notebookcheck Logo

AMD Radeon 860M vs AMD Radeon 840M

AMD Radeon 860M

► remove from comparison AMD Radeon 860M

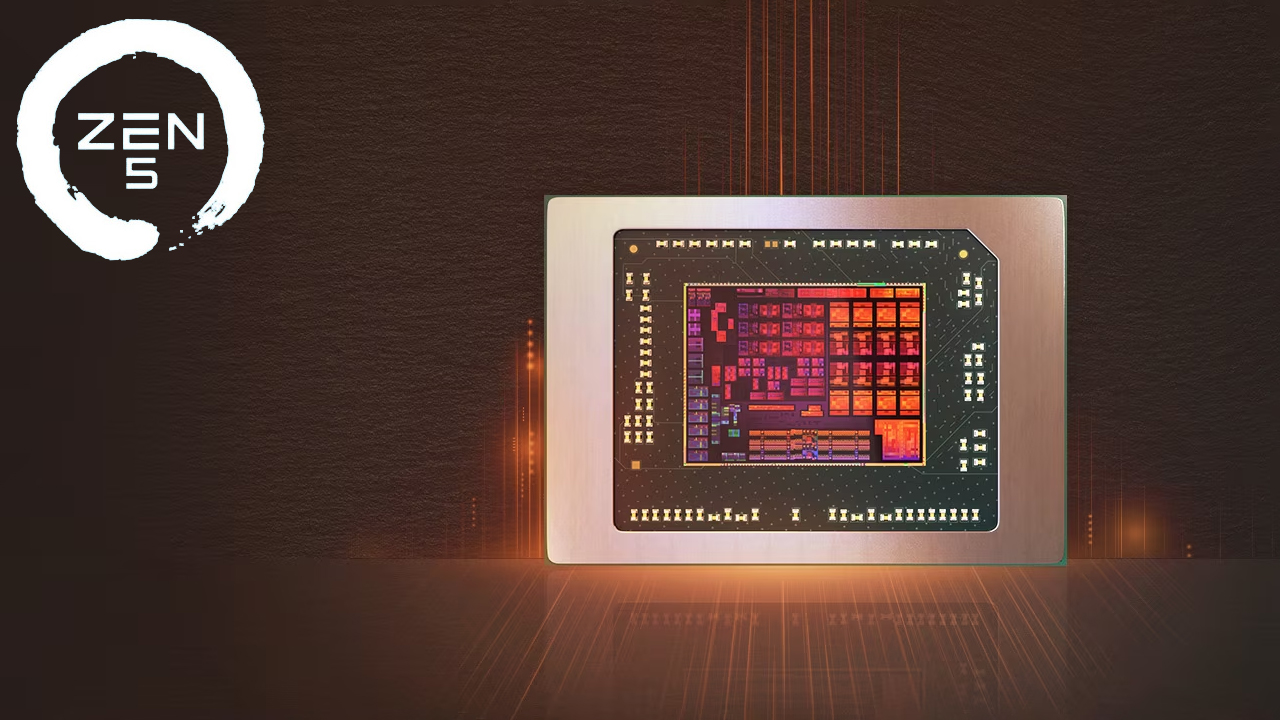
Die AMD Radeon 860M ist eine starke integrierte Grafikkarte in Strix Point / Krackan Point APUs. Sie basiert auf die aktuelle RDNA 3+ Architektur und wurde Mitte 2024 vorgestellt. Die 860M bietet 8 der 16 Compute Units (CUS, 512 Unified Shader) mit bis zu 3.000 MHz. Wie auch die 700M iGPUs, die 800M Serie unterstützt bis zu 4 Monitore mit Auflösungen bis zu SUHD 4230p60.

Die Spieleleistung sollte oberhalb der Radeon 760M liegen (ebenfalls 8 CUs) und daher auch für viele anspruchsvolle Spiele in niedriger Detailstufe reichen.

Die AMD Radeon 860M ist im SoC integriert und wird daher ebenfalls bei TSMC im modernen 4nm Prozess gefertigt.

AMD Radeon 840M

► remove from comparison AMD Radeon 840M

Die AMD Radeon 840M ist eine starke integrierte Grafikkarte in Strix Point / Krackan Point APUs. Sie basiert auf die aktuelle RDNA 3+ Architektur und wurde Anfang 2025 vorgestellt. Die 840M bietet 4 der 16 Compute Units (CUS, 256 Unified Shader) mit bis zu 2.900 MHz. Wie auch die 700M iGPUs, die 800M Serie unterstützt bis zu 4 Monitore mit Auflösungen bis zu SUHD 4230p60.

Die Spieleleistung sollte oberhalb der Radeon 740M liegen (ebenfalls 4 CUs) und daher auch für viele anspruchsvolle Spiele in niedriger Detailstufe reichen.

Die AMD Radeon 840M ist im SoC integriert und wird daher ebenfalls bei TSMC im modernen 4nm Prozess gefertigt.

AMD Radeon 860MAMD Radeon 840M
AMD Radeon 800M Serie
Radeon 890M compare 1024 @ 2.9 GHz? Bit @ 7500 MHz
Radeon 880M compare 768 @ 2.9 GHz? Bit @ 7500 MHz
Radeon 860M 512 @ 2.9 GHz? Bit @ 7500 MHz
Radeon 840M 256 @ 2.9 GHz? Bit @ 7500 MHz
Radeon 890M compare 1024 @ 2.9 GHz? Bit @ 7500 MHz
Radeon 880M compare 768 @ 2.9 GHz? Bit @ 7500 MHz
Radeon 860M 512 @ 2.9 GHz? Bit @ 7500 MHz
Radeon 840M 256 @ 2.9 GHz? Bit @ 7500 MHz
CodenameKrackan PointKrackan Point
ArchitekturRDNA 3+RDNA 3+
Pipelines512 - unified256 - unified
Raytracing Cores84
Kerntakt2900 (Boost) MHz2900 (Boost) MHz
Speichertakt7500 MHz7500 MHz
Shared Memoryjaja
APIDirectX 12_2DirectX 12_2
Herstellungsprozess4 nm4 nm
PCIe44
Displays4 Displays (max.), HDMI 2.1, DisplayPort 2.14 Displays (max.), HDMI 2.1, DisplayPort 2.1
FeaturesFreeSync, Miracast, SUHD 4320p60 resolution support, AVC/HEVC/VP9/AV1 encoding and decodingFreeSync, Miracast, SUHD 4320p60 resolution support, AVC/HEVC/VP9/AV1 encoding and decoding
Notebookgrößemittel (15.4" z.B.)mittel (15.4" z.B.)
Erscheinungsdatum02.06.2024 02.06.2024
PredecessorRadeon 760MRadeon 740M
CPU in Radeon 860MGPU Base SpeedGPU Boost / Turbo
AMD Ryzen AI 7 3508 x 2000 MHz, 28 W? MHz3000 MHz
AMD Ryzen AI 7 PRO 3508 x 2000 MHz, 28 W? MHz3000 MHz
min. - max.? MHz3000 MHz
CPU in Radeon 840MGPU Base SpeedGPU Boost / Turbo
AMD Ryzen AI 5 3406 x 2000 MHz, 28 W? MHz2900 MHz
AMD Ryzen AI 5 PRO 3406 x 2000 MHz, 28 W? MHz2900 MHz
min. - max.? MHz2900 MHz

Benchmarks

Performance Rating - 3DMark 11 + Fire Strike + Time Spy - Radeon 860M
2.7 pt (8%)
Restrict / Search: Model: Max. age: years
Performance Rating - 3DMark 11 + Fire Strike + Time Spy - Radeon 840M
2.1 pt (6%)
Restrict / Search: Model: Max. age: years
3DMark - 3DMark Time Spy Score
min: 1883     avg: 2937     median: 3147 (8%)     max: 3347 Points
1928 Points (5%)
3DMark - 3DMark Time Spy Graphics
min: 1656     avg: 2626     median: 2868 (6%)     max: 2987 Points
1705 Points (3%)
3DMark - 3DMark Cloud Gate Score
22791 Points (22%)
26645 Points (25%)
3DMark - 3DMark Cloud Gate Graphics
24614 Points (6%)
37360 Points (9%)
3DMark - 3DMark Fire Strike Standard Score
min: 3999     avg: 6314     median: 6715 (10%)     max: 7241 Points
5208 Points (8%)
3DMark - 3DMark Fire Strike Standard Graphics
min: 4449     avg: 6910     median: 7335 (7%)     max: 7935 Points
5606 Points (5%)
3DMark - 3DMark Ice Storm Graphics
210628 Points (23%)
236090 Points (26%)
3DMark - 3DMark Wild Life Extreme Unlimited
min: 5570     avg: 5872     median: 6020 (7%)     max: 6025 Points
3DMark 11 - 3DM11 Performance Score
min: 6804     avg: 10859     median: 11800 (14%)     max: 12267 Points
8814 Points (11%)
3DMark 11 - 3DM11 Performance GPU
min: 6901     avg: 10803     median: 11680 (9%)     max: 12149 Points
8453 Points (6%)
3DMark Vantage
3DM Vant. Perf. total + AMD Radeon 860M
3DMark Vantage - 3DM Vant. Perf. total
24821 Points (7%)
3DM Vant. Perf. total + AMD Radeon 840M
28720 Points (8%)
3DM Vant. Perf. GPU no PhysX + AMD Radeon 860M
3DMark Vantage - 3DM Vant. Perf. GPU no PhysX
20346 Points (11%)
3DM Vant. Perf. GPU no PhysX + AMD Radeon 840M
24793 Points (14%)
3DMark 06 3DMark 06 - Standard 1280x1024 + AMD Radeon 860M
3DMark 06
15774 Points (21%)
3DMark 06 - Standard 1280x1024 + AMD Radeon 840M
34953 Points (46%)
3DMark 06 - Standard 1280x720 + AMD Radeon 860M
3DMark 06
14855 Points (19%)
3DMark 06 - Standard 1024x768 + AMD Radeon 860M
3DMark 06
14920 Points (19%)
Cinebench R10 Cinebench R10 Shading (32bit) + AMD Radeon 860M
Cinebench R10 - Cinebench R10 Shading (32bit)
4517 Points (3%)
Cinebench R10 Shading (32bit) + AMD Radeon 840M
20280 Points (14%)
Cinebench R15
Cinebench R15 OpenGL 64 Bit + AMD Radeon 860M
Cinebench R15 - Cinebench R15 OpenGL 64 Bit
min: 145.7     avg: 220.9     median: 238 (14%)     max: 253 fps
Cinebench R15 OpenGL 64 Bit + AMD Radeon 840M
181.3 fps (11%)
Cinebench R15 OpenGL Ref. Match 64 Bit + AMD Radeon 860M
Cinebench R15 - Cinebench R15 OpenGL Ref. Match 64 Bit
97.9 % (98%)
Cinebench R15 OpenGL Ref. Match 64 Bit + AMD Radeon 840M
97.9 % (98%)
GFXBench - GFXBench 5.0 4K Aztec Ruins High Tier Offscreen
min: 16.89     avg: 24.2     median: 24.1 (9%)     max: 31.4 fps
25 fps (9%)
GFXBench - GFXBench 5.0 Aztec Ruins High Tier Offscreen
min: 35.2     avg: 51.3     median: 51.3 (9%)     max: 67.4 fps
56 fps (10%)
GFXBench - GFXBench 5.0 Aztec Ruins Normal Tier Offscreen
min: 81.5     avg: 119.1     median: 119.1 (9%)     max: 156.6 fps
139.4 fps (10%)
GFXBench - GFXBench Car Chase Offscreen
min: 97.2     avg: 135.5     median: 135.5 (13%)     max: 173.7 fps
GFXBench 3.1 - GFXBench Manhattan ES 3.1 Offscreen
229.4 fps (5%)
GFXBench 3.0 - GFXBench 3.0 Manhattan Offscreen
289.7 fps (12%)
GFXBench (DX / GLBenchmark) 2.7
GFXBench T-Rex HD Offscreen C24Z16 + AMD Radeon 860M
GFXBench (DX / GLBenchmark) 2.7 - GFXBench T-Rex HD Offscreen C24Z16
494.5 fps (4%)
Basemark GPU 1.2 - Basemark GPU 1.2 Vulkan Official Medium Offscreen 1080
min: 104.6     avg: 230.8     median: 315 (8%)     max: 315 fps
104.6 fps (3%)
Geekbench 6.4 - Geekbench 6.4 GPU OpenCL
min: 22403     avg: 24794     median: 24584 (6%)     max: 27133 Points
13004 Points (3%)
Geekbench 6.4 - Geekbench 6.4 GPU Vulkan
min: 26038     avg: 35242     median: 36748 (9%)     max: 38899 Points
22639 Points (6%)
LuxMark v2.0 64Bit - LuxMark v2.0 Room GPU
536 Samples/s (2%)
367 Samples/s (1%)
LuxMark v2.0 64Bit - LuxMark v2.0 Sala GPU
974 Samples/s (2%)
720 Samples/s (1%)
ComputeMark v2.1 - ComputeMark v2.1 Result
6397 Points (5%)
4356 Points (4%)
Power Consumption - Furmark Stress Test Power Consumption - external Monitor *
min: 47     avg: 59.4     median: 61.5 (8%)     max: 65.9 Watt
53.9 Watt (7%)
Power Consumption - Cyberpunk 2077 Power Consumption 150cd *
min: 54.5     avg: 71     median: 65.4 (19%)     max: 85.3 Watt
54.8 Watt (16%)
Power Consumption - Cyberpunk 2077 Power Consumption - external Monitor *
min: 58     avg: 71.2     median: 65.7 (8%)     max: 84.7 Watt
52.6 Watt (7%)
Power Consumption - Power Efficiency - Cyberpunk 2077 ultra
min: 0.181     avg: 0.2     median: 0.2 (1%)     max: 0.2984 fps per Watt
0.2 fps per Watt (1%)

Average Benchmarks AMD Radeon 860M → 100% n=24

Average Benchmarks AMD Radeon 840M → 107% n=24

- Bereich der Benchmarkergebnisse für diese Grafikkarte
red legend - Durchschnittliche Benchmarkergebnisse für diese Grafikkarte
* Smaller numbers mean a higher performance
1 This benchmark is not used for the average calculation

Spiele-Benchmarks

Die folgenden Benchmarks basieren auf unseren Spieletests mit Testnotebooks. Die Performance dieser Grafikkarte bei den gelisteten Spielen ist abhängig von der verwendeten CPU, Speicherausstattung, Treiber und auch Betriebssystem. Dadurch müssen die untenstehenden Werte nicht repräsentativ sein. Detaillierte Informationen über das verwendete System sehen Sie nach einem Klick auf den fps-Wert.

low 1920x1080
Radeon 840M:
12  fps
med. 1920x1080
Radeon 840M:
11  fps
high 1920x1080
Radeon 840M:
9  fps
low 1920x1080
Radeon 840M:
78.5  fps
med. 1920x1080
Radeon 840M:
39.1  fps
high 1920x1080
Radeon 840M:
20.1  fps
low 1920x1080
Radeon 840M:
23.8  fps
med. 1920x1080
Radeon 840M:
17.1  fps
high 1920x1080
Radeon 840M:
13.9  fps
low 1920x1080
Radeon 840M:
13.8  fps
high 1920x1080
Radeon 840M:
0 (!)  fps
Stalker 2

Stalker 2

2024
low 1920x1080
Radeon 840M:
11.9  fps
med. 1920x1080
Radeon 840M:
10.1  fps
high 1920x1080
Radeon 840M:
8.1  fps
low 1920x1080
Radeon 840M:
25.9  fps
med. 1920x1080
Radeon 840M:
16.1  fps
high 1920x1080
Radeon 840M:
10.5  fps
low 1920x1080
Radeon 840M:
15.9  fps
med. 1920x1080
Radeon 840M:
13.8  fps
high 1920x1080
Radeon 840M:
12.2  fps
low 1920x1080 cinem.
Radeon 840M:
7.5  fps
med. 1920x1080 cinem.
Radeon 840M:
6.6  fps
high 1920x1080 cinem.
Radeon 840M:
5.3  fps
F1 24

F1 24

2024
low 1920x1080
100%
Radeon 860M:
61.3 72.9 77.2 ~ 70 fps
63%
Radeon 840M:
44  fps
med. 1920x1080
100%
Radeon 860M:
54.1 65.2 69.6 ~ 63 fps
60%
Radeon 840M:
38  fps
high 1920x1080
100%
Radeon 860M:
48.7 51.8 ~ 50 fps
54%
Radeon 840M:
27  fps
ultra 1920x1080
100%
Radeon 860M:
10.4 10.6 ~ 11 fps
low 1920x1080
Radeon 840M:
10.5  fps
med. 1920x1080
Radeon 840M:
8.8  fps
high 1920x1080
Radeon 840M:
6.4  fps
low 1920x1080
Radeon 840M:
20.1  fps
med. 1920x1080
Radeon 840M:
15.9  fps
high 1920x1080
Radeon 840M:
13.2  fps
low 1920x1080
Radeon 840M:
18.2  fps
med. 1920x1080
Radeon 840M:
15.4  fps
high 1920x1080
Radeon 840M:
10.6  fps
low 1920x1080
Radeon 840M:
15.3  fps
high 1920x1080
Radeon 840M:
11.3  fps
low 1920x1080
Radeon 840M:
22.5  fps
med. 1920x1080
Radeon 840M:
16.7  fps
high 1920x1080
Radeon 840M:
14.7  fps
med. 1920x1080
Radeon 840M:
162.8  fps
high 1920x1080
Radeon 840M:
113.5  fps
low 1920x1080
Radeon 840M:
84.4  fps
med. 1920x1080
Radeon 840M:
68  fps
high 1920x1080
Radeon 840M:
29.6  fps
low 1920x1080
100%
Radeon 860M:
24.3 37.1 40.4 40.4 42.8 ~ 37 fps
67%
Radeon 840M:
24.8  fps
med. 1920x1080
100%
Radeon 860M:
18.9 28.3 29.9 31 32.8 ~ 28 fps
66%
Radeon 840M:
18.4  fps
high 1920x1080
100%
Radeon 860M:
12.3 22.4 23.6 24.3 25.5 ~ 22 fps
69%
Radeon 840M:
15.2  fps
ultra 1920x1080
100%
Radeon 860M:
11.1 17.9 19.1 19.9 20.9 ~ 18 fps
68%
Radeon 840M:
12.2  fps
low 1920x1080
100%
Radeon 860M:
23.6 34 36 36.9 37 ~ 34 fps
68%
Radeon 840M:
23.1  fps
med. 1920x1080
100%
Radeon 860M:
17.9 26.2 29 29.9 30.1 ~ 27 fps
69%
Radeon 840M:
18.6  fps
high 1920x1080
100%
Radeon 860M:
14.6 20.4 23 23.5 23.6 ~ 21 fps
63%
Radeon 840M:
13.3  fps
ultra 1920x1080
100%
Radeon 860M:
14.3 20 22.5 22.9 23.1 ~ 21 fps
61%
Radeon 840M:
12.8  fps
Strange Brigade

Strange Brigade

2018
low 1280x720
100%
Radeon 860M:
88.5 165.4 171.3 177.3 ~ 151 fps
87%
Radeon 840M:
131.9  fps
med. 1920x1080
100%
Radeon 860M:
34.7 65 68.2 70.8 ~ 60 fps
84%
Radeon 840M:
50.6  fps
high 1920x1080
100%
Radeon 860M:
29.3 53.9 55.7 58.7 ~ 49 fps
84%
Radeon 840M:
41.1  fps
ultra 1920x1080
100%
Radeon 860M:
25.2 45.5 45.7 48.5 ~ 41 fps
83%
Radeon 840M:
34.2  fps
Far Cry 5

Far Cry 5

2018
low 1280x720
100%
Radeon 860M:
97 104 ~ 101 fps
med. 1920x1080
100%
Radeon 860M:
47 52 ~ 50 fps
high 1920x1080
100%
Radeon 860M:
43 47 ~ 45 fps
ultra 1920x1080
100%
Radeon 860M:
40 44 ~ 42 fps
low 1280x720
100%
Radeon 860M:
52.9 66.3 73.6 77.2 77.6 ~ 70 fps
84%
Radeon 840M:
59  fps
med. 1920x1080
100%
Radeon 860M:
41.6 52.3 58.4 59 59.7 ~ 54 fps
78%
Radeon 840M:
42  fps
high 1920x1080
100%
Radeon 860M:
34.9 43.4 47.7 47.8 48.6 ~ 44 fps
83%
Radeon 840M:
36.5  fps
low 1280x720
100%
Radeon 860M:
40.6 66.7 78.7 83.9 85.6 ~ 71 fps
86%
Radeon 840M:
61.1  fps
med. 1920x1080
100%
Radeon 860M:
21.6 35.5 37.9 39.2 41.5 ~ 35 fps
73%
Radeon 840M:
25.6  fps
high 1920x1080
100%
Radeon 860M:
15.5 23.7 27.1 27.4 28.6 ~ 24 fps
70%
Radeon 840M:
16.7  fps
low 1280x720
100%
Radeon 860M:
78.2 164.8 165.9 166.4 167.5 ~ 149 fps
112%
Radeon 840M:
167.5  fps
med. 1366x768
100%
Radeon 860M:
50.9 122.6 134.9 137.9 139.5 ~ 117 fps
106%
Radeon 840M:
124.5  fps
high 1920x1080
100%
Radeon 860M:
50.7 80.4 82.1 83.4 84.8 ~ 76 fps
97%
Radeon 840M:
73.7  fps
ultra 1920x1080
100%
Radeon 860M:
39.8 74.2 77 78.1 78.7 ~ 70 fps
94%
Radeon 840M:
66  fps
GTA V

GTA V

2015
low 1024x768
100%
Radeon 860M:
125.1 169.9 172.5 173.2 173.8 ~ 163 fps
100%
Radeon 840M:
163.2  fps
med. 1366x768
100%
Radeon 860M:
113.6 153.3 157.2 157.4 160.5 ~ 148 fps
102%
Radeon 840M:
151.5  fps
high 1920x1080
100%
Radeon 860M:
33.6 57.4 70 74.7 76 ~ 62 fps
73%
Radeon 840M:
45.4  fps
ultra 1920x1080
100%
Radeon 860M:
13.5 22.2 27.8 28 30.7 ~ 24 fps
76%
Radeon 840M:
18.3  fps

Average Gaming AMD Radeon 860M → 100%

Average Gaming 30-70 fps → 100%

Average Gaming AMD Radeon 840M → 79%

Average Gaming 30-70 fps → 79%

AMD Radeon 860MAMD Radeon 840M
lowmed.highultraQHD4Klowmed.highultraQHD4K
Assassin's Creed Shadows12119
Civilization 778.539.120.1
Kingdom Come Deliverance 223.817.113.9
Indiana Jones and the Great Circle13.8
Stalker 211.910.18.1
Until Dawn25.916.110.5
Space Marine 215.913.812.2
Star Wars Outlaws7.56.635.29
F1 2470635011443827
Senua's Saga Hellblade 210.58.786.43
Ghost of Tsushima20.115.913.2
Horizon Forbidden West18.215.410.6
Dragon's Dogma 215.311.3
Helldivers 222.516.714.7
Prince of Persia The Lost Crown162.8113.5
Counter-Strike 284.46829.6
Cyberpunk 2077 2.2 Phantom Liberty3728221824.818.415.212.2
Baldur's Gate 33427212123.118.613.312.8
Strange Brigade151604941131.950.641.134.2
X-Plane 11.11705444594236.5
Final Fantasy XV Benchmark71352461.125.616.7
Dota 2 Reborn1491177670167.5124.573.766
GTA V1631486224163.2151.545.418.3
AMD Radeon 860MAMD Radeon 840M
lowmed.highultraQHD4Klowmed.highultraQHD4K
< 30 fps
< 60 fps
< 120 fps
≥ 120 fps

2
3
3
2
2
3
1
3
3
2
4
1
1


< 30 fps
< 60 fps
< 120 fps
≥ 120 fps
14
2
3
3
13
4
1
3
17
3
2
3
1
1


Eine Liste mit weiteren Spielen und allen Grafikkarten finden Sie auf unserer Seite: Welches Spiel ist mit welcher Grafikkarte spielbar?

Add one or more devices and compare

In the following list you can select (and also search for) devices that should be added to the comparison. You can select more than one device.

restrict list:
v1.33
log 16. 03:32:04

#0 ran 0s before starting gpusingle class +0s ... 0s

#1 checking url part for id 12988 +0s ... 0s

#2 checking url part for id 12990 +0s ... 0s

#3 not redirecting to Ajax server +0s ... 0s

#4 did not recreate cache, as it is less than 5 days old! Created at Fri, 13 Jun 2025 05:19:57 +0200 +0s ... 0s

#5 composed specs +0.014s ... 0.014s

#6 did output specs +0s ... 0.014s

#7 start showIntegratedCPUs +0s ... 0.014s

#8 getting avg benchmarks for device 12988 +0.013s ... 0.027s

#9 got single benchmarks 12988 +0.007s ... 0.034s

#10 getting avg benchmarks for device 12990 +0.003s ... 0.037s

#11 got single benchmarks 12990 +0.003s ... 0.041s

#12 got avg benchmarks for devices +0s ... 0.041s

#13 min, max, avg, median took s +0.026s ... 0.066s

#14 before gaming benchmark output +0s ... 0.066s

#15 Got 215 rows for game benchmarks. +0.011s ... 0.077s

#16 composed SQL query for gamebenchmarks +0s ... 0.077s

#17 got data and put it in $dataArray +0.001s ... 0.078s

#18 benchmarks composed for output. +0.008s ... 0.086s

#19 calculated avg scores. +0s ... 0.086s

#20 return log +0.001s ... 0.088s

Teilen Sie diesen Artikel, um uns zu unterstützen. Jeder Link hilft!
Mail Logo
> Notebook Test, Laptop Test und News > Benchmarks / Technik > Benchmarks / Technik > Grafikkarten Vergleich - Head 2 Head
Autor: Klaus Hinum,  8.09.2017 (Update:  1.07.2023)