AMD Ryzen 9 9955HX3D ► remove from comparison The AMD Ryzen 9 9955HX3D is a high-end notebook processor of the Fire Range series with 16 cores and hyperthreading (SMT), which means it can process up to 32 threads simultaneously. The CPU uses the new Zen 5 architecture for all 16 cores and clocks them at 2.5 to 5.4 GHz (single-core boost). As a special feature, the HX3D has an additional 64M 3D V-Cache on a CCD. This means that the CPU offers combined 128 MB L3 cache and 16 MB L2 cache. The chip was presented at CES in early 2025 and is intended for fast and expensive gaming notebooks.
AMD claims that the Ryzen 9 9955HX3D is the fastest mobile gaming CPU. Based on the experience with its predecessor, the Ryzen 9 7945HX3D , this is quite realistic. The 3D V-Cache in particular can accelerate demanding 3D games. However, the 16 fast Zen 5 cores should also provide enough power for all possible demanding applications.
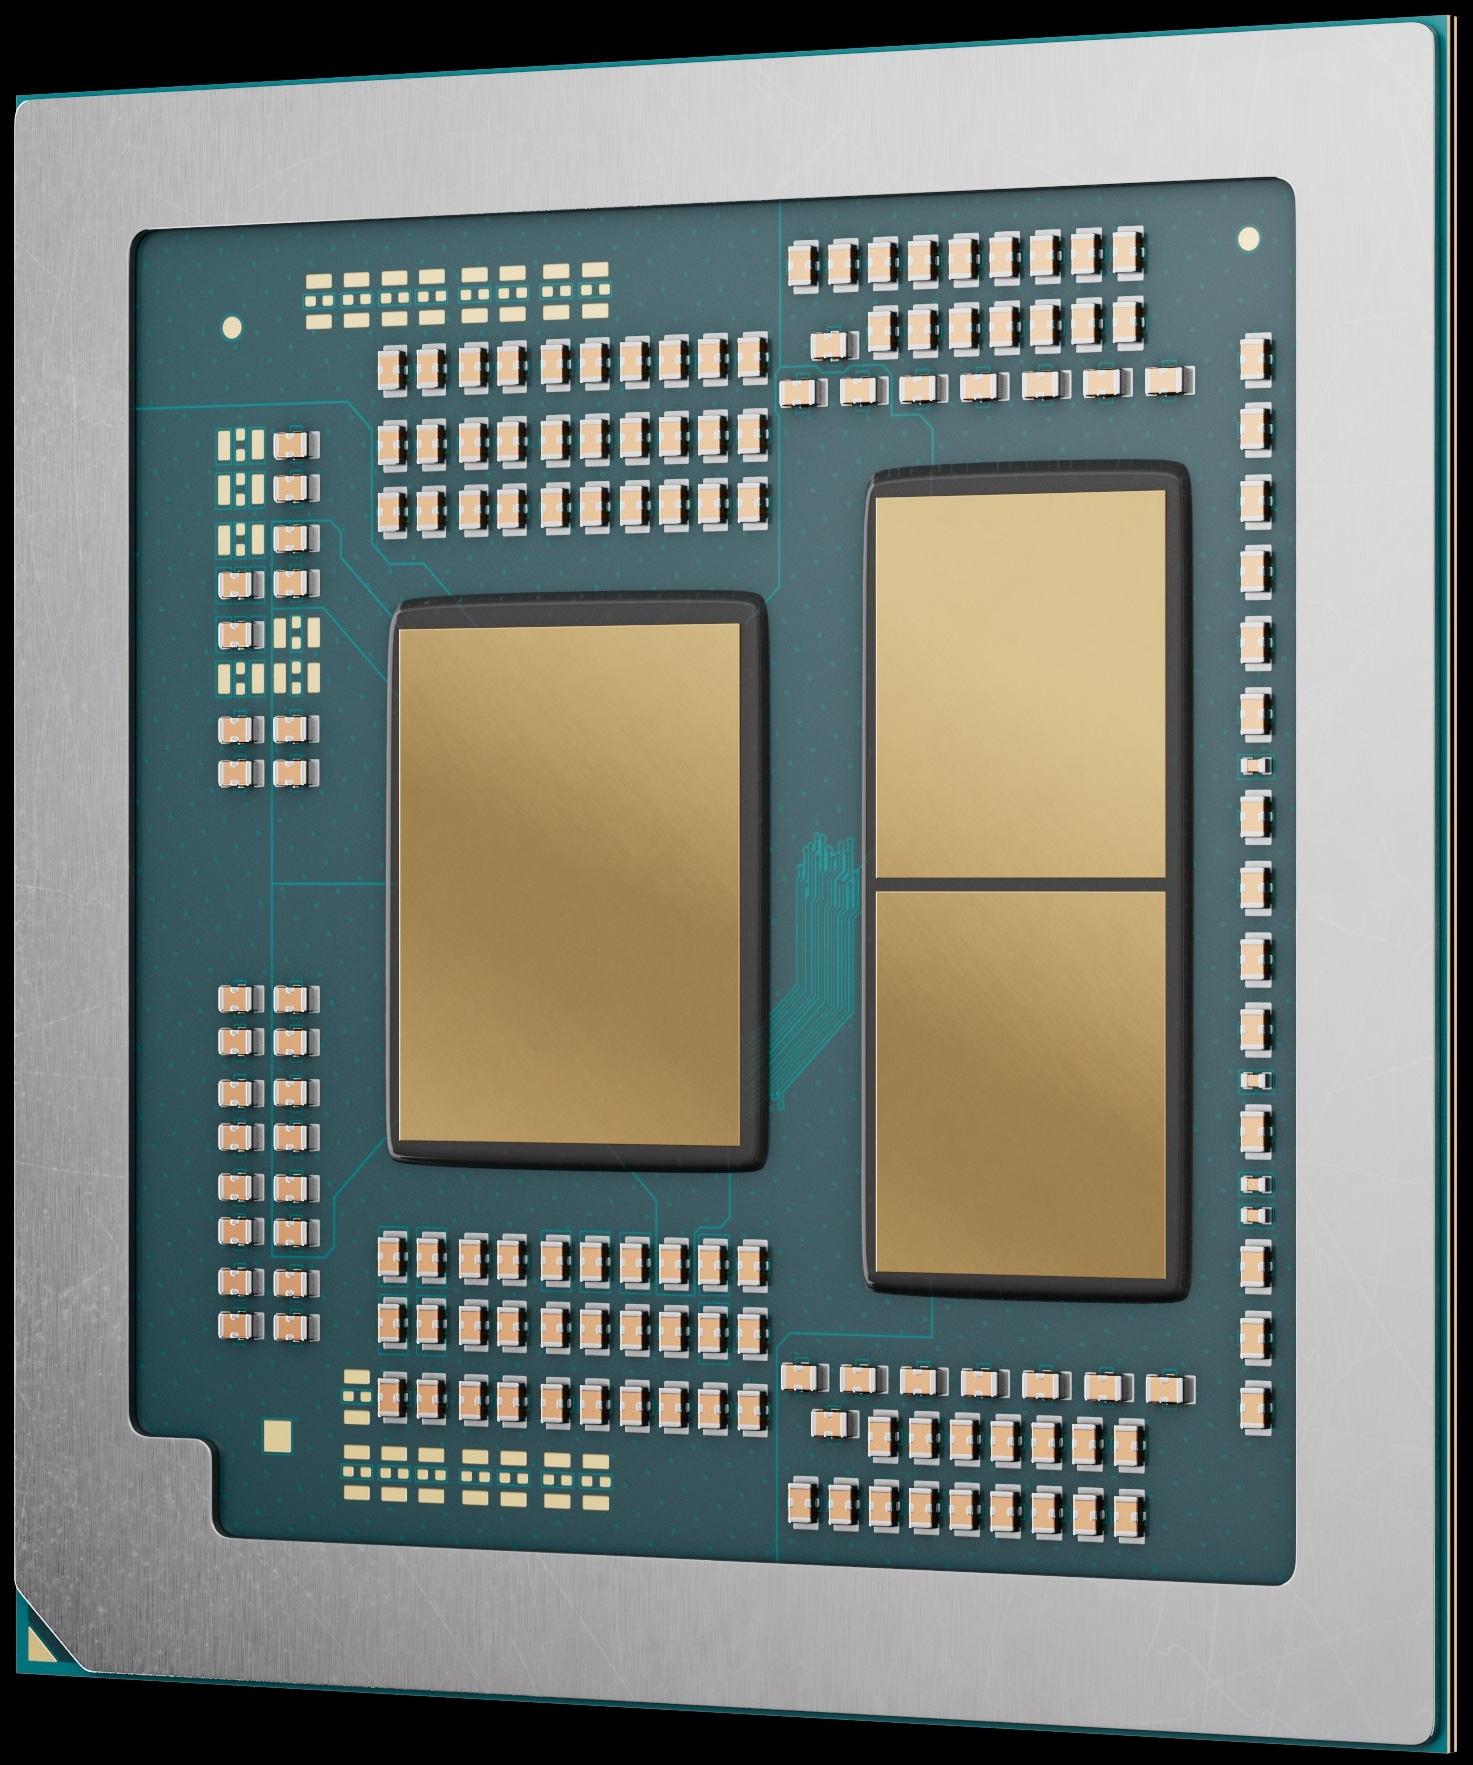
The 9955HX3D is intended for large and heavy gaming notebooks and can therefore draw quite an amount of power (configurable from 55- to 75 watts TDP, default 55 watts). The SoC consists out of three dies on a package where the processor dies are manufactured in the modern 4nm 4nm FinFET process at TSMC (I/O die in 6nm) and should therefore still have a good energy efficiency.
AMD Ryzen 9 9955HX ► remove from comparison The AMD Ryzen 9 9955HX is a high-end notebook processor from the Fire Range series with 16 cores and hyperthreading (SMT), which means it can process up to 32 threads simultaneously. Unlike the Ryzen 9 9955HX3D, the chip does not offer a 3D V-Cache. The chip was presented at CES in early 2025 and is intended for fast and expensive gaming laptops.
Thanks to the high-clocked 16 Zen 5 cores, the performance of the CPU should be excellent and only be outperformed by the 9955HX3D thanks to the 3D V-Cache. Together with the Intel Core Ultra 9 285HX at the top of the mobile CPUs.
The 9955HX is intended for large and heavy gaming notebooks and is therefore configurable from 55-75 watts TDP (default 55 watts). The SoC is manufactured in the modern 4nm FinFET process at TSMC (both compute dies, I/O die in 6nm) and should therefore have very good energy efficiency.
Model AMD Ryzen 9 9955HX3D AMD Ryzen 9 9955HX Codename Fire Range-HX (Zen 5) Fire Range-HX (Zen 5) Series AMD Dragon Range (Zen 4, Ryzen 7X4X/8X4X) AMD Dragon Range (Zen 4, Ryzen 7X4X/8X4X) Series: Dragon Range (Zen 4, Ryzen 7X4X/8X4X) Fire Range-HX (Zen 5) Clock 2500 - 5400 MHz 2500 - 5400 MHz L1 Cache 1.3 MB 1.3 MB L2 Cache 16 MB 16 MB L3 Cache 128 MB 64 MB Cores / Threads 16 / 32 16 / 32 TDP 55 Watt 55 Watt Technology 4 nm 4 nm iGPU AMD Radeon 610M ( - 2200 MHz)AMD Radeon 610M ( - 2200 MHz)Architecture x86 x86 Announced Manufacturer www.amd.com www.amd.com
Performance Rating - CB R15 + R20 + 7-Zip + X265 + Blender + 3DM11 CPU - R9 9955HX3D
Performance Rating - CB R15 + R20 + 7-Zip + X265 + Blender + 3DM11 CPU - R9 9955HX
Cinebench 2024 - Cinebench 2024 CPU Single Core
min: 129.4 avg: 129.7 median: 129.7 (73%) max: 130 Points
CPU TDP ? TDP 135 W TDP 145 W 100% 100% 100%
min: 125.3 avg: 128.9 median: 129.5 (73%) max: 130 Points
CPU TDP ? TDP 90 W TDP 100 W TDP 110 W TDP 135 W TDP 145 W 100% 100% 100% 99% 100% 98%
Cinebench 2024 - Cinebench 2024 CPU Multi Core
min: 2072 avg: 2117 median: 2120 (39%) max: 2160 Points
CPU TDP ? TDP 135 W TDP 145 W 100% 96% 98%
min: 1775 avg: 1951 median: 1971.5 (37%) max: 2069 Points
CPU TDP ? TDP 90 W TDP 100 W TDP 110 W TDP 135 W TDP 145 W 100% 89% 85% 92% 99% 99%
Cinebench R23 - Cinebench R23 Multi Core
min: 38864 avg: 39065 median: 39065 (36%) max: 39266 Points
CPU TDP 135 W TDP 145 W 99% 100%
min: 36078 avg: 38155 median: 39384 (37%) max: 39690 Points
CPU TDP ? TDP 90 W TDP 100 W TDP 110 W TDP 135 W TDP 145 W 100% 93% 91% 91% 98% 100%
Cinebench R23 - Cinebench R23 Single Core
min: 2165 avg: 2172 median: 2172 (91%) max: 2179 Points
CPU TDP 135 W TDP 145 W 99% 100%
min: 1828 avg: 2128 median: 2176 (92%) max: 2183 Points
CPU TDP ? TDP 90 W TDP 100 W TDP 110 W TDP 135 W TDP 145 W 100% 100% 100% 100% 99% 92%
Cinebench R20 - Cinebench R20 CPU (Single Core)
min: 847 avg: 849 median: 849 (92%) max: 851 Points
CPU TDP 135 W TDP 145 W 100% 100%
min: 819 avg: 848 median: 853 (93%) max: 854 Points
CPU TDP ? TDP 90 W TDP 100 W TDP 110 W TDP 135 W TDP 145 W 100% 100% 99% 100% 100% 98%
Cinebench R20 - Cinebench R20 CPU (Multi Core)
min: 15146 avg: 15162 median: 15161.5 (37%) max: 15177 Points
CPU TDP 135 W TDP 145 W 100% 100%
min: 14166 avg: 14877 median: 15309 (37%) max: 15524 Points
CPU TDP ? TDP 90 W TDP 100 W TDP 110 W TDP 135 W TDP 145 W 100% 93% 92% 92% 99% 100%
Cinebench R15 - Cinebench R15 CPU Multi 64 Bit
min: 6041 avg: 6043 median: 6042.5 (38%) max: 6044 Points
CPU TDP 135 W TDP 145 W 100% 100%
min: 5639 avg: 5933 median: 6046 (38%) max: 6103 Points
CPU TDP ? TDP 90 W TDP 100 W TDP 110 W TDP 135 W TDP 145 W 100% 97% 93% 93% 99% 100%
Cinebench R15 - Cinebench R15 CPU Single 64 Bit
min: 321 avg: 327 median: 327 (91%) max: 333 Points
CPU TDP 135 W TDP 145 W 96% 100%
min: 320 avg: 334.1 median: 336 (93%) max: 338 Points
CPU TDP ? TDP 90 W TDP 100 W TDP 110 W TDP 135 W TDP 145 W 99% 100% 100% 99% 95% 97%
Cinebench R11.5 - Cinebench R11.5 CPU Multi 64 Bit
min: 69.12 avg: 69.9 median: 69.9 (90%) max: 70.66 Points
CPU TDP 135 W TDP 145 W 100% 98%
min: 64.66 avg: 67.4 median: 67.4 (87%) max: 69.87 Points
CPU TDP ? TDP 100 W TDP 110 W TDP 135 W TDP 145 W 99% 92% 92% 100% 98%
Cinebench R11.5 - Cinebench R11.5 CPU Single 64 Bit
CPU TDP 135 W TDP 145 W 100% 100%
min: 3.72 avg: 3.9 median: 3.9 (94%) max: 3.97 Points
CPU TDP ? TDP 100 W TDP 110 W TDP 135 W TDP 145 W 96% 100% 99% 100% 100%
Cinebench R10 - Cinebench R10 Rend. Single (32bit)
min: 9264 avg: 9269 median: 9269 (56%) max: 9274 Points
CPU TDP 135 W TDP 145 W 100% 100%
min: 8710 avg: 9087 median: 9178.5 (55%) max: 9279 Points
CPU TDP ? TDP 100 W TDP 110 W TDP 135 W TDP 145 W 96% 99% 100% 100% 100%
Cinebench R10 - Cinebench R10 Rend. Multi (32bit)
min: 77481 avg: 79410 median: 79410 (58%) max: 81339 Points
CPU TDP 135 W TDP 145 W 95% 100%
min: 73626 avg: 76474 median: 76058 (55%) max: 80152 Points
CPU TDP ? TDP 100 W TDP 110 W TDP 135 W TDP 145 W 97% 91% 92% 95% 100%
Cinebench R10 - Cinebench R10 Rend. Multi (64bit)
min: 14159 avg: 76087 median: 76087 (49%) max: 138015 Points
CPU TDP 100 W TDP 110 W TDP 135 W 95% 10% 100%
Cinebench R10 - Cinebench R10 Rend. Single (64bit)
min: 17067 avg: 17205 median: 17205 (21%) max: 17343 Points
CPU TDP 100 W TDP 110 W TDP 135 W 100% 98% 99%
wPrime 2.10 - wPrime 2.0 1024m *
min: 135 avg: 172.7 median: 172.7 (2%) max: 210.4 s
CPU TDP 135 W TDP 145 W 101% 100%
min: 32.998 avg: 90.4 median: 33.9 (0%) max: 204.3 s
CPU TDP ? TDP 100 W TDP 110 W TDP 135 W TDP 145 W 100% 102% 102% 101% 100%
wPrime 2.10 - wPrime 2.0 32m *
min: 4.4 avg: 5 median: 5 (1%) max: 5.5 s
CPU TDP 135 W TDP 145 W 100% 100%
min: 2.195 avg: 3.3 median: 2.2 (0%) max: 5.6 s
CPU TDP ? TDP 100 W TDP 110 W TDP 135 W TDP 145 W 100% 101% 101% 100% 100%
WinRAR - WinRAR 4.0
min: 11412 avg: 29422 median: 29421.5 (47%) max: 47431 Points
CPU TDP 135 W TDP 145 W 24% 100%
min: 9033 avg: 21586 median: 10079 (16%) max: 45647 Points
CPU TDP ? TDP 100 W TDP 110 W TDP 135 W TDP 145 W 96% 19% 21% 24% 100%
7-Zip 18.03 - 7-Zip 18.03 Multi Thread 4 runs
min: 145803 avg: 146945 median: 146944 (84%) max: 148086 MIPS
CPU TDP 135 W TDP 145 W 98% 100%
min: 132435 avg: 139265 median: 141048 (81%) max: 144064 MIPS
CPU TDP ? TDP 90 W TDP 100 W TDP 110 W TDP 135 W TDP 145 W 98% 93% 91% 93% 100% 99%
7-Zip 18.03 - 7-Zip 18.03 Single Thread 4 runs
min: 7151 avg: 7226 median: 7225.5 (85%) max: 7300 MIPS
CPU TDP 135 W TDP 145 W 98% 100%
min: 7061 avg: 7300 median: 7393 (87%) max: 7462 MIPS
CPU TDP ? TDP 90 W TDP 100 W TDP 110 W TDP 135 W TDP 145 W 98% 99% 100% 96% 96% 97%
X264 HD Benchmark 4.0 - x264 Pass 2
min: 233.5 avg: 234.8 median: 234.8 (6%) max: 236 fps
CPU TDP 100 W TDP 110 W TDP 135 W 91% 92% 100%
X264 HD Benchmark 4.0 - x264 Pass 1
min: 343.5 avg: 351.3 median: 351.3 (9%) max: 359 fps
CPU TDP 100 W TDP 110 W TDP 135 W 99% 94% 100%
HWBOT x265 Benchmark v2.2 - HWBOT x265 4k Preset
min: 42.3 avg: 42.5 median: 42.5 (75%) max: 42.7 fps
CPU TDP 135 W TDP 145 W 100% 99%
min: 38.9 avg: 41.4 median: 42.1 (74%) max: 43 fps
CPU TDP ? TDP 90 W TDP 100 W TDP 110 W TDP 135 W TDP 145 W 100% 94% 91% 94% 100% 100%
TrueCrypt - TrueCrypt Serpent
min: 3.2 avg: 3.3 median: 3.3 (97%) max: 3.4 GB/s
CPU TDP 135 W TDP 145 W 100% 94%
min: 3.1 avg: 3.1 median: 3.1 (91%) max: 3.4 GB/s
CPU TDP 100 W TDP 110 W TDP 135 W TDP 145 W 91% 91% 100% 94%
TrueCrypt - TrueCrypt Twofish
min: 4.5 avg: 5 median: 5 (85%) max: 5.4 GB/s
CPU TDP 135 W TDP 145 W 100% 83%
min: 4.9 avg: 5 median: 5 (85%) max: 5 GB/s
CPU TDP 100 W TDP 110 W TDP 135 W TDP 145 W 91% 93% 100% 83%
TrueCrypt - TrueCrypt AES
min: 27.5 avg: 29.1 median: 29.1 (76%) max: 30.6 GB/s
CPU TDP 135 W TDP 145 W 100% 90%
min: 27.3 avg: 27.6 median: 27.6 (72%) max: 27.9 GB/s
CPU TDP 100 W TDP 110 W TDP 135 W TDP 145 W 91% 89% 100% 90%
Blender - Blender 3.3 Classroom CPU *
CPU TDP 135 W TDP 145 W 100% 100%
min: 122 avg: 129.7 median: 125 (2%) max: 145 Seconds
CPU TDP ? TDP 90 W TDP 100 W TDP 110 W TDP 135 W TDP 145 W 100% 100% 100% 100% 100% 100%
Blender - Blender 2.79 BMW27 CPU *
CPU TDP 135 W TDP 145 W 100% 100%
min: 80 avg: 84.6 median: 85 (1%) max: 91 Seconds
CPU TDP ? TDP 90 W TDP 100 W TDP 110 W TDP 135 W TDP 145 W 100% 100% 100% 100% 100% 100%
R Benchmark 2.5 - R Benchmark 2.5 *
min: 0.3552 avg: 0.4 median: 0.4 (8%) max: 0.3677 sec
CPU TDP 135 W TDP 145 W 100% 100%
min: 0.3517 avg: 0.4 median: 0.4 (8%) max: 0.3737 sec
CPU TDP ? TDP 90 W TDP 100 W TDP 110 W TDP 135 W TDP 145 W 100% 100% 100% 100% 100% 100%
3DMark 06 - CPU - 3DMark 06 - CPU
min: 19498 avg: 19963 median: 19731 (42%) max: 20890 Points
CPU TDP ? TDP 100 W TDP 110 W 100% 94% 94%
Super Pi mod 1.5 XS 1M - Super Pi mod 1.5 XS 1M *
CPU TDP 135 W TDP 145 W 100% 100%
min: 7.701 avg: 7.9 median: 7.8 (2%) max: 8.2 s
CPU TDP ? TDP 100 W TDP 110 W TDP 135 W TDP 145 W 100% 100% 100% 100% 100%
Super Pi mod 1.5 XS 2M - Super Pi mod 1.5 XS 2M *
CPU TDP 135 W TDP 145 W 100% 100%
min: 16.472 avg: 16.8 median: 16.6 (1%) max: 17.5 s
CPU TDP ? TDP 100 W TDP 110 W TDP 135 W TDP 145 W 100% 100% 100% 100% 100%
Super Pi Mod 1.5 XS 32M - Super Pi mod 1.5 XS 32M *
min: 373 avg: 373.3 median: 373.3 (2%) max: 373.6 s
CPU TDP 135 W TDP 145 W 100% 100%
CPU TDP ? TDP 135 W TDP 145 W 100% 100% 100%
3DMark Vantage - 3DM Vant. Perf. CPU no Physx
min: 93819 avg: 98006 median: 98275.5 (75%) max: 101654 Points
CPU TDP ? TDP 100 W TDP 110 W 100% 97% 92%
3DMark 11 - 3DM11 Performance Physics
min: 33212 avg: 34146 median: 34146 (84%) max: 35080 Points
CPU TDP 135 W TDP 145 W 95% 100%
min: 29429 avg: 32133 median: 32436.5 (80%) max: 33671 Points
CPU TDP ? TDP 90 W TDP 100 W TDP 110 W TDP 135 W TDP 145 W 97% 94% 89% 94% 98% 100%
3DMark - 3DMark Ice Storm Physics
min: 78557 avg: 82036 median: 83067 (67%) max: 84483 Points
CPU TDP 100 W TDP 110 W 96% 100%
3DMark - 3DMark Ice Storm Extreme Physics
min: 78596 avg: 81706 median: 81638 (66%) max: 84884 Points
CPU TDP 100 W TDP 110 W 94% 100%
3DMark - 3DMark Ice Storm Unlimited Physics
min: 81426 avg: 82900 median: 81582 (66%) max: 85692 Points
CPU TDP 100 W TDP 110 W 95% 100%
3DMark - 3DMark Cloud Gate Physics
min: 23962 avg: 24593 median: 23963 (61%) max: 25855 Points
CPU TDP 100 W TDP 110 W 93% 100%
3DMark - 3DMark Fire Strike Standard Physics
min: 37856 avg: 41184 median: 42689 (76%) max: 43007 Points
CPU TDP ? TDP 135 W TDP 145 W 99% 88% 100%
min: 37802 avg: 41920 median: 42652.5 (76%) max: 44312 Points
CPU TDP ? TDP 90 W TDP 100 W TDP 110 W TDP 135 W TDP 145 W 98% 99% 89% 97% 87% 100%
3DMark - 3DMark Time Spy CPU
min: 12913 avg: 13307 median: 13082 (55%) max: 13926 Points
CPU TDP ? TDP 135 W TDP 145 W 100% 93% 94%
min: 9758 avg: 12610 median: 13012 (55%) max: 13348 Points
CPU TDP ? TDP 90 W TDP 100 W TDP 110 W TDP 135 W TDP 145 W 100% 100% 84% 97% 97% 96%
Geekbench 6.5 - Geekbench 6.5 Single-Core
min: 3146 avg: 3188 median: 3184.5 (77%) max: 3237 Points
CPU TDP ? TDP 135 W TDP 145 W 99% 98% 100%
min: 3156 avg: 3215 median: 3230 (78%) max: 3253 Points
CPU TDP ? TDP 90 W TDP 100 W TDP 110 W TDP 135 W TDP 145 W 99% 100% 100% 97% 97% 98%
Geekbench 6.5 - Geekbench 6.5 Multi-Core
min: 19788 avg: 20200 median: 20231 (79%) max: 20551 Points
CPU TDP ? TDP 135 W TDP 145 W 98% 97% 100%
min: 16313 avg: 18689 median: 19052 (74%) max: 19587 Points
CPU TDP ? TDP 90 W TDP 100 W TDP 110 W TDP 135 W TDP 145 W 98% 98% 94% 96% 100% 92%
Geekbench 6.0 - Geekbench 6.0 Single-Core
CPU TDP 100 W TDP 135 W 100% 97%
Geekbench 6.0 - Geekbench 6.0 Multi-Core
CPU TDP 100 W TDP 135 W 94% 100%
Geekbench 5.5 - Geekbench 5.1 - 5.5 64 Bit Single-Core
min: 2381 avg: 2391 median: 2391 (91%) max: 2401 Points
CPU TDP 135 W TDP 145 W 100% 99%
min: 2307 avg: 2380 median: 2395 (91%) max: 2425 Points
CPU TDP ? TDP 90 W TDP 100 W TDP 110 W TDP 135 W TDP 145 W 100% 97% 99% 97% 99% 97%
Geekbench 5.5 - Geekbench 5.1 - 5.5 64 Bit Multi-Core
min: 23468 avg: 23569 median: 23568.5 (42%) max: 23669 Points
CPU TDP 135 W TDP 145 W 99% 100%
min: 20576 avg: 21787 median: 21893 (39%) max: 22406 Points
CPU TDP ? TDP 90 W TDP 100 W TDP 110 W TDP 135 W TDP 145 W 93% 95% 88% 93% 100% 98%
Geekbench 5.0 - Geekbench 5.0 64 Bit Single-Core
min: 2233 avg: 2235 median: 2235 (10%) max: 2237 Points
CPU TDP 100 W TDP 110 W TDP 135 W 98% 99% 100%
Geekbench 5.0 - Geekbench 5.0 64 Bit Multi-Core
min: 20686 avg: 21227 median: 21227 (67%) max: 21768 Points
CPU TDP 100 W TDP 110 W TDP 135 W 88% 92% 100%
Geekbench 4.4 - Geekbench 4.1 - 4.4 64 Bit Single-Core
min: 9140 avg: 9238 median: 9237.5 (92%) max: 9335 Points
CPU TDP 100 W TDP 110 W TDP 135 W 96% 98% 100%
Geekbench 4.4 - Geekbench 4.1 - 4.4 64 Bit Multi-Core
min: 87050 avg: 88125 median: 88125 (86%) max: 89200 Points
CPU TDP 100 W TDP 110 W TDP 135 W 89% 91% 100%
Mozilla Kraken 1.1 - Kraken 1.1 Total Score *
CPU TDP 135 W TDP 145 W 100% 100%
min: 397 avg: 415.3 median: 404 (0%) max: 453 ms
CPU TDP ? TDP 90 W TDP 100 W TDP 110 W TDP 135 W TDP 145 W 100% 100% 100% 100% 100% 100%
Octane V2 - Octane V2 Total Score
CPU TDP 90 W TDP 145 W 100% 97%
WebXPRT 4 - WebXPRT 4 Score
min: 320 avg: 326.5 median: 326.5 (90%) max: 333 Points
CPU TDP 135 W TDP 145 W 100% 96%
min: 287 avg: 301.8 median: 298.8 (82%) max: 322 Points
CPU TDP ? TDP 90 W TDP 100 W TDP 110 W TDP 135 W TDP 145 W 90% 86% 94% 87% 100% 96%
WebXPRT 3 - WebXPRT 3 Score
min: 342 avg: 354 median: 354 (64%) max: 366 Points
CPU TDP 135 W TDP 145 W 100% 93%
min: 315 avg: 335 median: 335 (60%) max: 361 Points
CPU TDP ? TDP 90 W TDP 100 W TDP 110 W TDP 135 W TDP 145 W 87% 92% 96% 92% 100% 96%
CrossMark - CrossMark Overall
min: 2199 avg: 2243 median: 2264 (85%) max: 2265 Points
CPU TDP ? TDP 135 W TDP 145 W 100% 100% 97%
min: 2176 avg: 2214 median: 2220.5 (83%) max: 2259 Points
CPU TDP ? TDP 90 W TDP 100 W TDP 110 W TDP 135 W TDP 145 W 99% 98% 98% 98% 100% 97%
Power Consumption - Prime95 Power Consumption - external Monitor *
min: 216 avg: 222 median: 222 (38%) max: 228 Watt
CPU TDP 135 W TDP 145 W 103% 100%
min: 122.3 avg: 169.1 median: 162.5 (28%) max: 229 Watt
CPU TDP 90 W TDP 100 W TDP 110 W TDP 135 W TDP 145 W 123% 130% 115% 104% 100%
Power Consumption - Cinebench R15 Multi Power Consumption - external Monitor *
min: 143.7 avg: 179.6 median: 176.8 (32%) max: 221 Watt
CPU TDP 90 W TDP 100 W TDP 110 W TDP 145 W 112% 124% 115% 100%
Power Consumption - Idle Power Consumption - external Monitor *
min: 12.3 avg: 35.1 median: 35.1 (23%) max: 57.8 Watt
CPU TDP 135 W TDP 145 W 100% 149%
min: 19.3 avg: 27.4 median: 27.3 (18%) max: 35.6 Watt
CPU TDP 90 W TDP 100 W TDP 110 W TDP 135 W TDP 145 W 124% 141% 130% 100% 142%
Power Consumption - Idle Power Consumption 150cd 1min *
min: 14.2 avg: 30.1 median: 30.1 (36%) max: 45.9 Watt
CPU TDP 135 W TDP 145 W 100% 186%
min: 13.6 avg: 18.2 median: 15.7 (19%) max: 25.2 Watt
CPU TDP 90 W TDP 110 W TDP 135 W TDP 145 W 182% 188% 100% 171%
Power Consumption - Power Efficiency - Cinebench R15 Multi external Monitor
27.3 Points per Watt (20%)
min: 32.6 avg: 35 median: 32.8 (24%) max: 39.5 Points per Watt
CPU TDP 90 W TDP 100 W TDP 110 W TDP 145 W 83% 100% 83% 69%
Average Benchmarks AMD Ryzen 9 9955HX3D → 100% n=49 Average Benchmarks AMD Ryzen 9 9955HX → 106% n=49
- Range of benchmark values for this graphics card
- Average benchmark values for this graphics card
* Smaller numbers mean a higher performance
1 This benchmark is not used for the average calculation
log 19. 04:17:39
#0 ran 0s before starting gpusingle class +0s ... 0s
#1 checking url part for id 18729 +0s ... 0s
#2 checking url part for id 18731 +0s ... 0s
#3 not redirecting to Ajax server +0s ... 0s
#4 did not recreate cache, as it is less than 5 days old! Created at Thu, 16 Oct 2025 05:21:56 +0200 +0s ... 0s
#5 composed specs +0.004s ... 0.004s
#6 did output specs +0s ... 0.004s
#7 getting avg benchmarks for device 18729 +0.003s ... 0.007s
#8 got single benchmarks 18729 +0.007s ... 0.015s
#9 getting avg benchmarks for device 18731 +0.004s ... 0.019s
#10 got single benchmarks 18731 +0.012s ... 0.03s
#11 got avg benchmarks for devices +0s ... 0.03s
#12 min, max, avg, median took s +0.058s ... 0.088s
#13 return log +0.002s ... 0.09s