AMD Ryzen 9 9850HX ► remove from comparison The AMD Ryzen 9 9850HX is a high-end notebook processor from the Fire Range series with 12 of 16 cores and hyperthreading (SMT), which means it can process up to 24 threads simultaneously. Unlike the Ryzen 9 9955HX3D, the chip does not offer a 3D V-Cache. The chip was presented at CES in early 2025 and is intended for fast and expensive gaming laptops.
The CPU uses the new Zen 5 architecture for the 12 cores and clocks them at up to 5.2 GHz (single-core boost).
Thanks to the 12 fast Zen 5 cores, the performance should be excellent and well suited for all demanding applications. We assume that the performance will be similar to the old Ryzen 9 7845HX (12 x Zen 4 with up to 5.2 GHz) is similar. The faster Ryzen 9 9955HX and 9955HX3D should be able to set themselves apart significantly due to the higher number of cores (with multi-thread performance).
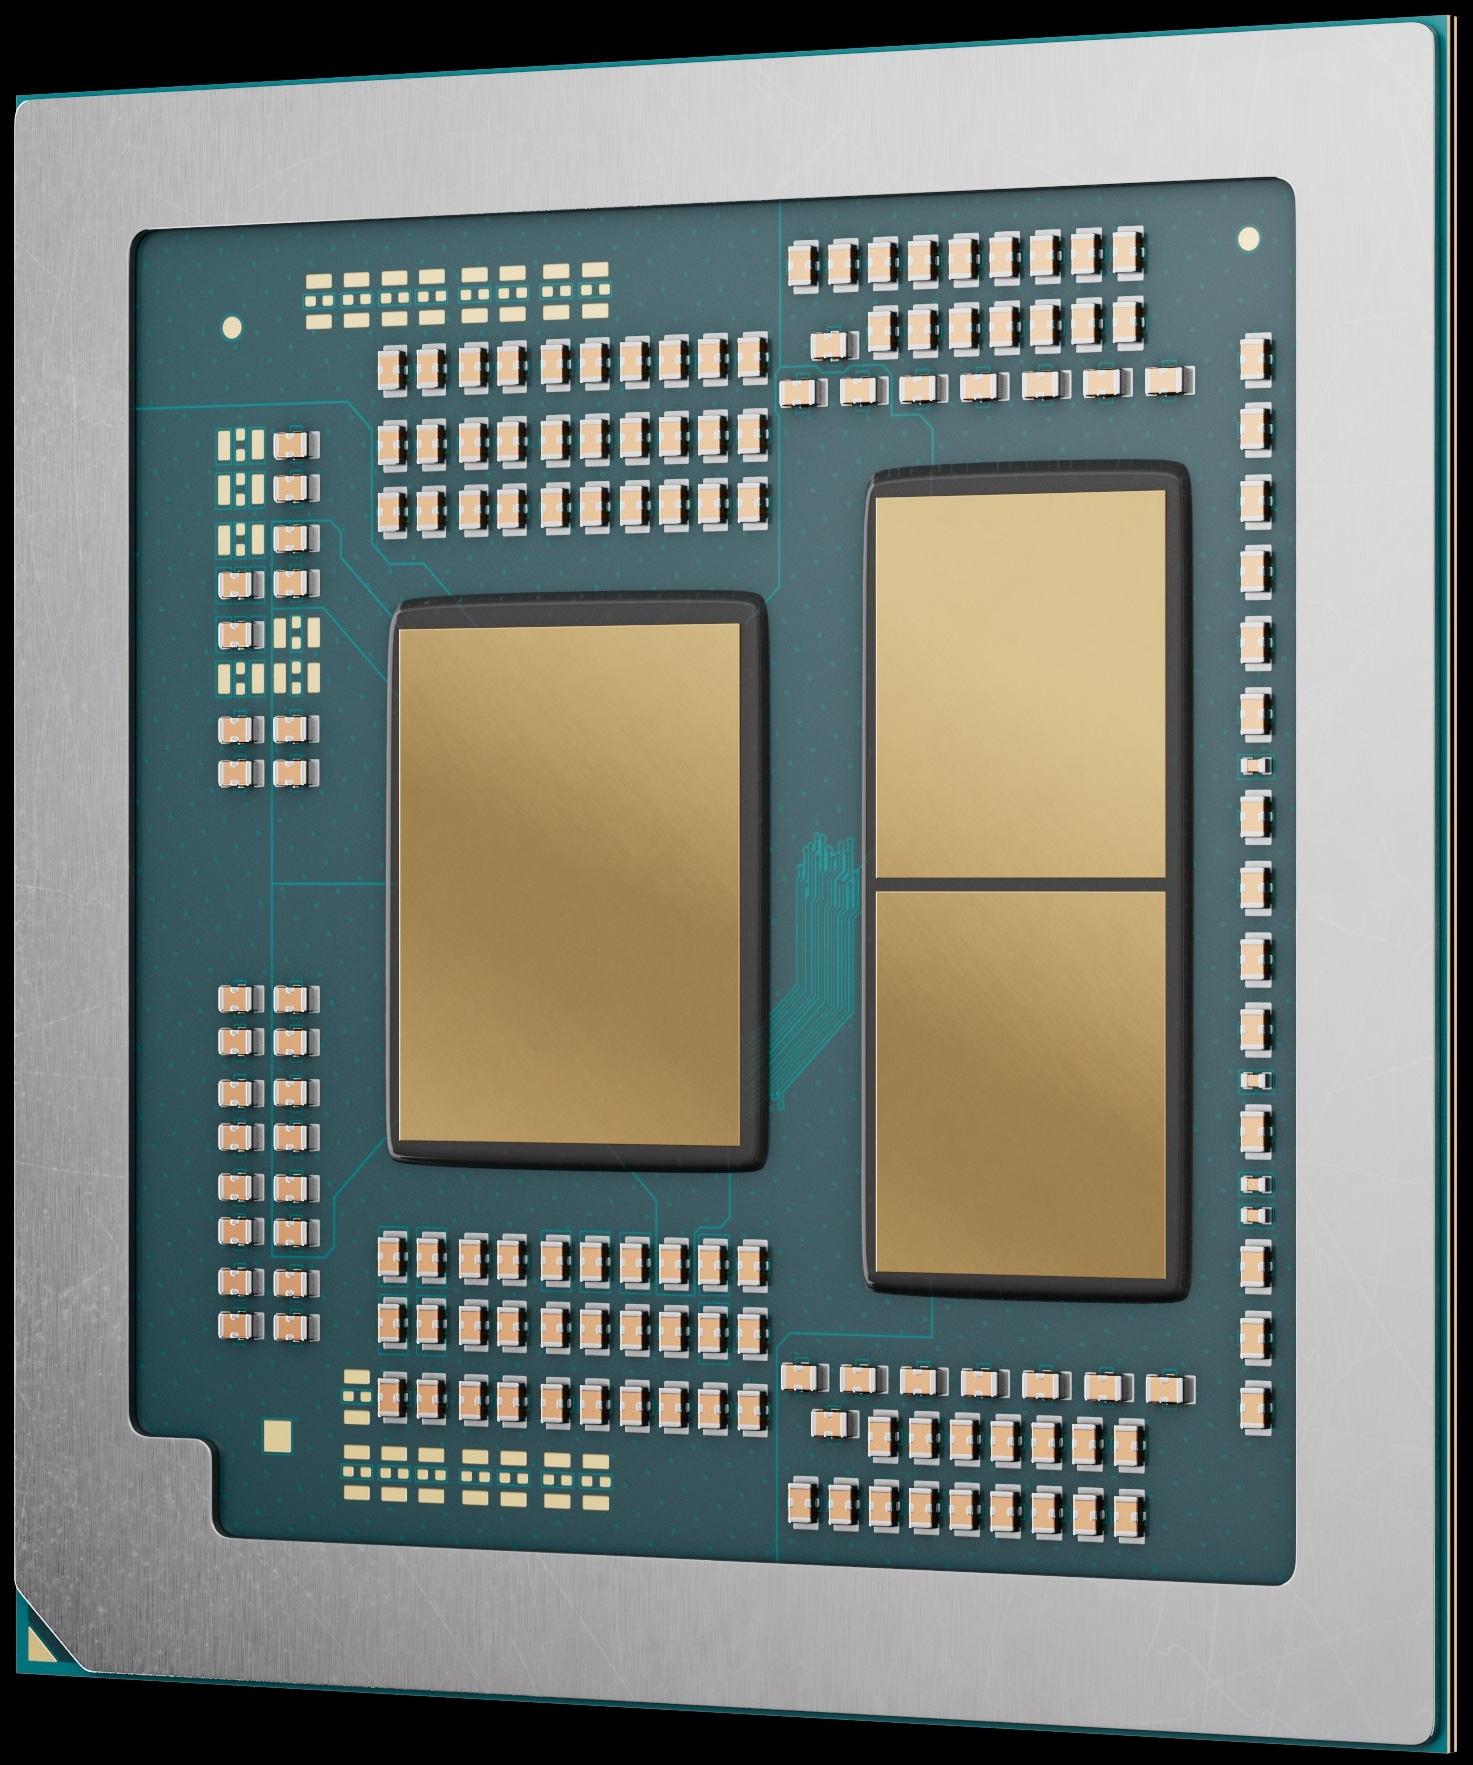
The 9850HX is intended for large and heavy gaming notebooks and is therefore configurable from 45 - 75 watts TDP (default 55 watts). The SoC is manufactured in the modern 4nm FinFET process at TSMC (both compute dies, I/O die in 6nm) and should therefore have very good energy efficiency.
AMD Ryzen 9 9955HX ► remove from comparison The AMD Ryzen 9 9955HX is a high-end notebook processor from the Fire Range series with 16 cores and hyperthreading (SMT), which means it can process up to 32 threads simultaneously. Unlike the Ryzen 9 9955HX3D, the chip does not offer a 3D V-Cache. The chip was presented at CES in early 2025 and is intended for fast and expensive gaming laptops.
Thanks to the high-clocked 16 Zen 5 cores, the performance of the CPU should be excellent and only be outperformed by the 9955HX3D thanks to the 3D V-Cache. Together with the Intel Core Ultra 9 285HX at the top of the mobile CPUs.
The 9955HX is intended for large and heavy gaming notebooks and is therefore configurable from 55-75 watts TDP (default 55 watts). The SoC is manufactured in the modern 4nm FinFET process at TSMC (both compute dies, I/O die in 6nm) and should therefore have very good energy efficiency.
Model AMD Ryzen 9 9850HX AMD Ryzen 9 9955HX Codename Fire Range-HX (Zen 5) Fire Range-HX (Zen 5) Series AMD Dragon Range (Zen 4, Ryzen 7X4X/8X4X) AMD Dragon Range (Zen 4, Ryzen 7X4X/8X4X) Series: Dragon Range (Zen 4, Ryzen 7X4X/8X4X) Fire Range-HX (Zen 5) Clock 3000 - 5200 MHz 2500 - 5400 MHz L1 Cache 960 KB 1.3 MB L2 Cache 12 MB 16 MB L3 Cache 64 MB 64 MB Cores / Threads 12 / 24 16 / 32 TDP 45 Watt 55 Watt iGPU AMD Radeon 610M ( - 2200 MHz)AMD Radeon 610M ( - 2200 MHz)Architecture x86 x86 Announced Manufacturer www.amd.com www.amd.com Technology 4 nm
Performance Rating - CB R15 + R20 + 7-Zip + X265 + Blender + 3DM11 CPU - R9 9955HX
Cinebench 2024 - Cinebench 2024 CPU Single Core
min: 125.3 avg: 128.9 median: 129.5 (73%) max: 130 Points
CPU TDP ? TDP 90 W TDP 100 W TDP 110 W TDP 145 W 100% 100% 100% 99% 96%
Cinebench 2024 - Cinebench 2024 CPU Multi Core
min: 1775 avg: 1951 median: 1971.5 (37%) max: 2069 Points
CPU TDP ? TDP 90 W TDP 100 W TDP 110 W TDP 145 W 100% 90% 86% 93% 98%
Cinebench R23 - Cinebench R23 Multi Core
min: 36078 avg: 38155 median: 39384 (37%) max: 39690 Points
CPU TDP ? TDP 90 W TDP 100 W TDP 110 W TDP 145 W 100% 92% 91% 91% 100%
Cinebench R23 - Cinebench R23 Single Core
min: 1828 avg: 2128 median: 2176 (92%) max: 2183 Points
CPU TDP ? TDP 90 W TDP 100 W TDP 110 W TDP 145 W 100% 100% 100% 100% 84%
Cinebench R20 - Cinebench R20 CPU (Single Core)
min: 819 avg: 848 median: 853 (93%) max: 854 Points
CPU TDP ? TDP 90 W TDP 100 W TDP 110 W TDP 145 W 100% 100% 99% 100% 96%
Cinebench R20 - Cinebench R20 CPU (Multi Core)
min: 14166 avg: 14877 median: 15309 (37%) max: 15524 Points
CPU TDP ? TDP 90 W TDP 100 W TDP 110 W TDP 145 W 99% 92% 91% 91% 100%
Cinebench R15 - Cinebench R15 CPU Multi 64 Bit
min: 5639 avg: 5933 median: 6046 (38%) max: 6103 Points
CPU TDP ? TDP 90 W TDP 100 W TDP 110 W TDP 145 W 100% 97% 93% 93% 100%
Cinebench R15 - Cinebench R15 CPU Single 64 Bit
min: 320 avg: 334.1 median: 336 (93%) max: 338 Points
CPU TDP ? TDP 90 W TDP 100 W TDP 110 W TDP 145 W 99% 100% 100% 99% 95%
Cinebench R11.5 - Cinebench R11.5 CPU Multi 64 Bit
min: 64.66 avg: 67.4 median: 67.4 (87%) max: 69.87 Points
CPU TDP ? TDP 100 W TDP 110 W 100% 94% 93%
Cinebench R11.5 - Cinebench R11.5 CPU Single 64 Bit
min: 3.72 avg: 3.9 median: 3.9 (94%) max: 3.97 Points
CPU TDP ? TDP 100 W TDP 110 W 96% 100% 100%
Cinebench R10 - Cinebench R10 Rend. Single (32bit)
min: 8710 avg: 9087 median: 9178.5 (55%) max: 9279 Points
CPU TDP ? TDP 100 W TDP 110 W 96% 99% 100%
Cinebench R10 - Cinebench R10 Rend. Multi (32bit)
min: 73626 avg: 76474 median: 76058 (55%) max: 80152 Points
CPU TDP ? TDP 100 W TDP 110 W 100% 94% 95%
Cinebench R10 - Cinebench R10 Rend. Multi (64bit)
min: 14159 avg: 76087 median: 76087 (49%) max: 138015 Points
CPU TDP 100 W TDP 110 W 100% 10%
Cinebench R10 - Cinebench R10 Rend. Single (64bit)
min: 17067 avg: 17205 median: 17205 (21%) max: 17343 Points
CPU TDP 100 W TDP 110 W 100% 98%
wPrime 2.10 - wPrime 2.0 1024m *
min: 32.998 avg: 90.4 median: 33.9 (0%) max: 204.3 s
CPU TDP ? TDP 100 W TDP 110 W 100% 102% 102%
wPrime 2.10 - wPrime 2.0 32m *
min: 2.195 avg: 3.3 median: 2.2 (0%) max: 5.6 s
CPU TDP ? TDP 100 W TDP 110 W 100% 101% 101%
WinRAR - WinRAR 4.0
min: 9033 avg: 21586 median: 10079 (16%) max: 45647 Points
CPU TDP ? TDP 100 W TDP 110 W 100% 20% 22%
7-Zip 18.03 - 7-Zip 18.03 Multi Thread 4 runs
min: 132435 avg: 139265 median: 141048 (81%) max: 144064 MIPS
CPU TDP ? TDP 90 W TDP 100 W TDP 110 W TDP 145 W 100% 95% 93% 95% 99%
7-Zip 18.03 - 7-Zip 18.03 Single Thread 4 runs
min: 7061 avg: 7300 median: 7393 (87%) max: 7462 MIPS
CPU TDP ? TDP 90 W TDP 100 W TDP 110 W TDP 145 W 98% 99% 100% 96% 97%
X264 HD Benchmark 4.0 - x264 Pass 2
min: 233.5 avg: 234.8 median: 234.8 (6%) max: 236 fps
CPU TDP 100 W TDP 110 W 99% 100%
X264 HD Benchmark 4.0 - x264 Pass 1
min: 343.5 avg: 351.3 median: 351.3 (9%) max: 359 fps
CPU TDP 100 W TDP 110 W 100% 96%
HWBOT x265 Benchmark v2.2 - HWBOT x265 4k Preset
min: 38.9 avg: 41.4 median: 42.1 (74%) max: 43 fps
CPU TDP ? TDP 90 W TDP 100 W TDP 110 W TDP 145 W 99% 93% 90% 94% 100%
TrueCrypt - TrueCrypt Serpent
min: 3.1 avg: 3.1 median: 3.1 (91%) max: 3.4 GB/s
CPU TDP 100 W TDP 110 W 100% 100%
TrueCrypt - TrueCrypt Twofish
min: 4.9 avg: 5 median: 5 (85%) max: 5 GB/s
CPU TDP 100 W TDP 110 W 98% 100%
TrueCrypt - TrueCrypt AES
min: 27.3 avg: 27.6 median: 27.6 (72%) max: 27.9 GB/s
CPU TDP 100 W TDP 110 W 100% 98%
Blender - Blender 3.3 Classroom CPU *
min: 122 avg: 129.7 median: 125 (2%) max: 145 Seconds
CPU TDP ? TDP 90 W TDP 100 W TDP 110 W TDP 145 W 100% 100% 100% 100% 100%
Blender - Blender 2.79 BMW27 CPU *
min: 80 avg: 84.6 median: 85 (1%) max: 91 Seconds
CPU TDP ? TDP 90 W TDP 100 W TDP 110 W TDP 145 W 100% 100% 100% 100% 100%
R Benchmark 2.5 - R Benchmark 2.5 *
min: 0.3517 avg: 0.4 median: 0.4 (8%) max: 0.3737 sec
CPU TDP ? TDP 90 W TDP 100 W TDP 110 W TDP 145 W 100% 100% 100% 100% 100%
3DMark 06 - CPU - 3DMark 06 - CPU
min: 19498 avg: 19963 median: 19731 (42%) max: 20890 Points
CPU TDP ? TDP 100 W TDP 110 W 100% 94% 94%
Super Pi mod 1.5 XS 1M - Super Pi mod 1.5 XS 1M *
min: 7.701 avg: 7.9 median: 7.8 (2%) max: 8.2 s
CPU TDP ? TDP 100 W TDP 110 W 100% 100% 100%
Super Pi mod 1.5 XS 2M - Super Pi mod 1.5 XS 2M *
min: 16.472 avg: 16.8 median: 16.6 (1%) max: 17.5 s
CPU TDP ? TDP 100 W TDP 110 W 100% 100% 100%
Super Pi Mod 1.5 XS 32M - Super Pi mod 1.5 XS 32M *
3DMark Vantage - 3DM Vant. Perf. CPU no Physx
min: 93819 avg: 98006 median: 98275.5 (75%) max: 101654 Points
CPU TDP ? TDP 100 W TDP 110 W 100% 97% 92%
3DMark 11 - 3DM11 Performance Physics
min: 29429 avg: 32133 median: 32436.5 (80%) max: 33671 Points
CPU TDP ? TDP 90 W TDP 100 W TDP 110 W TDP 145 W 100% 97% 91% 97% 99%
3DMark - 3DMark Ice Storm Physics
min: 78557 avg: 82036 median: 83067 (67%) max: 84483 Points
CPU TDP 100 W TDP 110 W 96% 100%
3DMark - 3DMark Ice Storm Extreme Physics
min: 78596 avg: 81706 median: 81638 (66%) max: 84884 Points
CPU TDP 100 W TDP 110 W 94% 100%
3DMark - 3DMark Ice Storm Unlimited Physics
min: 81426 avg: 82900 median: 81582 (66%) max: 85692 Points
CPU TDP 100 W TDP 110 W 95% 100%
3DMark - 3DMark Cloud Gate Physics
min: 23962 avg: 24593 median: 23963 (61%) max: 25855 Points
CPU TDP 100 W TDP 110 W 93% 100%
3DMark - 3DMark Fire Strike Standard Physics
min: 37802 avg: 41920 median: 42652.5 (76%) max: 44312 Points
CPU TDP ? TDP 90 W TDP 100 W TDP 110 W TDP 145 W 97% 97% 87% 95% 100%
3DMark - 3DMark Time Spy CPU
min: 9758 avg: 12610 median: 13012 (55%) max: 13348 Points
CPU TDP ? TDP 90 W TDP 100 W TDP 110 W TDP 145 W 99% 100% 84% 97% 94%
Geekbench 6.5 - Geekbench 6.5 Single-Core
min: 3156 avg: 3215 median: 3230 (78%) max: 3253 Points
CPU TDP ? TDP 90 W TDP 100 W TDP 110 W TDP 145 W 99% 100% 100% 97% 98%
Geekbench 6.5 - Geekbench 6.5 Multi-Core
min: 16313 avg: 18689 median: 19052 (74%) max: 19587 Points
CPU TDP ? TDP 90 W TDP 100 W TDP 110 W TDP 145 W 96% 100% 96% 98% 84%
Geekbench 6.0 - Geekbench 6.0 Single-Core
Geekbench 6.0 - Geekbench 6.0 Multi-Core
Geekbench 5.5 - Geekbench 5.1 - 5.5 64 Bit Single-Core
min: 2307 avg: 2380 median: 2395 (91%) max: 2425 Points
CPU TDP ? TDP 90 W TDP 100 W TDP 110 W TDP 145 W 100% 97% 99% 97% 95%
Geekbench 5.5 - Geekbench 5.1 - 5.5 64 Bit Multi-Core
min: 20576 avg: 21787 median: 21893 (39%) max: 22406 Points
CPU TDP ? TDP 90 W TDP 100 W TDP 110 W TDP 145 W 97% 99% 92% 98% 100%
Geekbench 5.0 - Geekbench 5.0 64 Bit Single-Core
min: 2233 avg: 2235 median: 2235 (10%) max: 2237 Points
CPU TDP 100 W TDP 110 W 100% 100%
Geekbench 5.0 - Geekbench 5.0 64 Bit Multi-Core
min: 20686 avg: 21227 median: 21227 (67%) max: 21768 Points
CPU TDP 100 W TDP 110 W 95% 100%
Geekbench 4.4 - Geekbench 4.1 - 4.4 64 Bit Single-Core
min: 9140 avg: 9238 median: 9237.5 (92%) max: 9335 Points
CPU TDP 100 W TDP 110 W 98% 100%
Geekbench 4.4 - Geekbench 4.1 - 4.4 64 Bit Multi-Core
min: 87050 avg: 88125 median: 88125 (86%) max: 89200 Points
CPU TDP 100 W TDP 110 W 98% 100%
Mozilla Kraken 1.1 - Kraken 1.1 Total Score *
min: 397 avg: 415.3 median: 404 (0%) max: 453 ms
CPU TDP ? TDP 90 W TDP 100 W TDP 110 W TDP 145 W 100% 100% 100% 100% 100%
Octane V2 - Octane V2 Total Score
WebXPRT 4 - WebXPRT 4 Score
min: 287 avg: 301.8 median: 298.8 (82%) max: 322 Points
CPU TDP ? TDP 90 W TDP 100 W TDP 110 W TDP 145 W 93% 89% 97% 90% 100%
WebXPRT 3 - WebXPRT 3 Score
min: 315 avg: 335 median: 335 (60%) max: 361 Points
CPU TDP ? TDP 90 W TDP 100 W TDP 110 W TDP 145 W 89% 93% 98% 94% 100%
CrossMark - CrossMark Overall
min: 2176 avg: 2214 median: 2220.5 (83%) max: 2259 Points
CPU TDP ? TDP 90 W TDP 100 W TDP 110 W TDP 145 W 100% 100% 100% 99% 98%
Power Consumption - Prime95 Power Consumption - external Monitor *
min: 122.3 avg: 169.1 median: 162.5 (28%) max: 229 Watt
CPU TDP 90 W TDP 100 W TDP 110 W TDP 145 W 123% 130% 115% 100%
Power Consumption - Cinebench R15 Multi Power Consumption - external Monitor *
min: 143.7 avg: 179.6 median: 176.8 (32%) max: 221 Watt
CPU TDP 90 W TDP 100 W TDP 110 W TDP 145 W 112% 124% 115% 100%
Power Consumption - Idle Power Consumption - external Monitor *
min: 19.3 avg: 27.4 median: 27.3 (18%) max: 35.6 Watt
CPU TDP 90 W TDP 100 W TDP 110 W TDP 145 W 100% 114% 105% 110%
Power Consumption - Idle Power Consumption 150cd 1min *
min: 13.6 avg: 18.2 median: 15.7 (19%) max: 25.2 Watt
CPU TDP 90 W TDP 110 W TDP 145 W 116% 120% 100%
Power Consumption - Power Efficiency - Cinebench R15 Multi external Monitor
min: 32.6 avg: 35 median: 32.8 (24%) max: 39.5 Points per Watt
CPU TDP 90 W TDP 100 W TDP 110 W 83% 100% 83%
Average Benchmarks AMD Ryzen 9 9850HX → 100% n=2 Average Benchmarks AMD Ryzen 9 9955HX → 104% n=2
- Range of benchmark values for this graphics card
- Average benchmark values for this graphics card
* Smaller numbers mean a higher performance
1 This benchmark is not used for the average calculation
log 19. 04:15:29
#0 ran 0s before starting gpusingle class +0s ... 0s
#1 checking url part for id 18733 +0s ... 0s
#2 checking url part for id 18731 +0s ... 0s
#3 not redirecting to Ajax server +0s ... 0s
#4 did not recreate cache, as it is less than 5 days old! Created at Thu, 16 Oct 2025 05:21:56 +0200 +0s ... 0s
#5 composed specs +0.004s ... 0.005s
#6 did output specs +0s ... 0.005s
#7 getting avg benchmarks for device 18733 +0.001s ... 0.005s
#8 got single benchmarks 18733 +0.004s ... 0.01s
#9 getting avg benchmarks for device 18731 +0.004s ... 0.013s
#10 got single benchmarks 18731 +0.011s ... 0.025s
#11 got avg benchmarks for devices +0s ... 0.025s
#12 min, max, avg, median took s +0.032s ... 0.057s
#13 return log +0.001s ... 0.058s