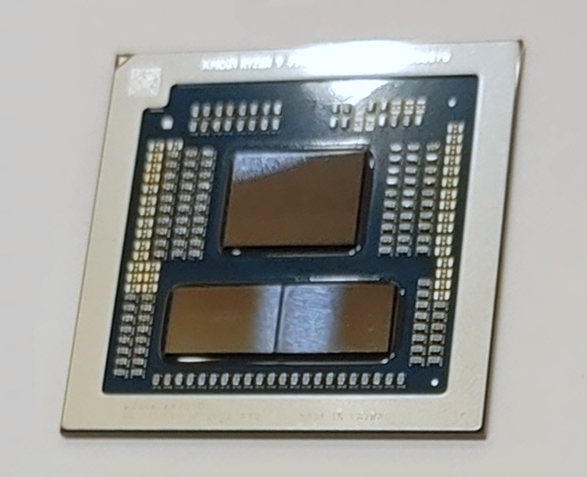
The AMD Ryzen 9 7940HX is a high-end notebook processor from the Dragon Range series with 16 cores and hyperthreading (SMT), which means it can process up to 32 threads simultaneously. The CPU uses the current Zen 4 architecture for the 16 cores and clocks these from 2.4 GHz (base clock) up to 5.2 GHz (single-core boost). The CPU offers 16 MB L2 cache and 64 MB L3 cache (i.e. a total of 80 MB cache). The 7940HX consists of three chiplets, two CCD clusters with 8 CPU cores each made with a 5nm node (71mm²) and one IO die on 6nm (122mm²), are all manufactured at TSMC's fabs.
The performance of the Ryzen 9 should be comparable to a Core i9-13900HX (24 hybrid cores, max 5.4 GHz) in the top range of mobile processors from 2024. AMD itself advertises a clear lead over the old Ryzen 9 6900HX (8 Zen 3 cores, 4.9 GHz), which can be explained by the additional cores, improved architecture and higher frequencies. Compared to the top model, the Ryzen 9 7945HX, the 7940HX is slightly lower clocked.
The chip also integrates 4x USB 3.2 Gen2 (10 Gbps) ports (no USB 4), 28 PCIe 5.0 lanes (for GPUs and SSDs), a dual-channel DDR5-5200 memory controller and a small AMD Radeon 610M graphics card (2CUs, 400 - 2200 MHz).
The R9 7940HX is specified with 55 watts TDP and can be configured up to 75 watts (cTDP).
The AMD Ryzen 9 7945HX is a fast high-end laptop processor of the Dragon Range series. It offers 16 cores based on the Zen 4 architecture that supports hyperthreading (32 threads). The cores clock from 2.5 (base) up to 5.4 GHz (single core boost). The 7945HX is the fastest mobile Ryzen CPU at launch and derived from the desktop Ryzen 9 7950X.
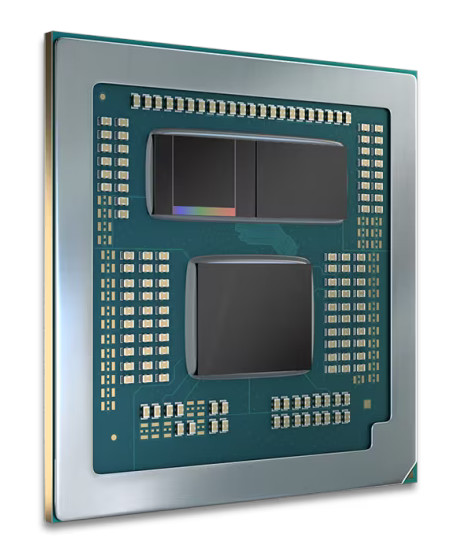
The Dragon Range series still uses a chiplet design with two CCD-clusters (each with 8 possible cores) in 5nm and an IO-die (including the memory controller and the Radeon 610M iGPU) in 6nm. The chip integrates 4x USB 3.2 Gen2 (10 Gbps) ports (no USB4), 28 PCIe 5.0 lanes (for GPU and SSDs) and a dual-channel DDR5-5200 memory controller.
Performance
The Ryzen 9 7945HX is among the fastest processors in our database, as of August 2023. It is in the same league as the Ryzen 9 7945HX3D and noticeably ahead of the Core i9-13980HX, as far as multi-thread benchmark scores are concerned. It is outrageously, unbelievably fast, and those fortunate enough to purchase a laptop built around this CPU will have no performance issues for at least three years.
Thanks to its powerful cooling solution and a long-term CPU power limit of 128 W, the ROG Strix Scar 17 G733PY-XS96 is one of the fastest laptops built around the 7945HX that we know of.
The R9 7945HX is rated at a TDP of 55 Watt and can be configured up to 75 Watt (cTDP).
The AMD Ryzen 9 7945HX3D is a fast high-end laptop processor of the Dragon Range series. It offers 16 cores based on the Zen 4 architecture that supports hyperthreading (32 threads). The cores clock from 2.3 (base) up to 5.4 GHz (single core boost). Compared to the similar R9 7945HX, the 7945HX3D offers an additional 64 MB 3D V-Cache on one CCD-Cluster. This helps in some workloads that can use the additional fast cache (e.g. some games). The guaranteed base clock however was reduced from 2.5 to 2.3 GHz.
The performance of the R9 7945HX3D is similar to the R9 7945HX in workloads that wont make use of the bigger L3 cache. Most games however can use the additional memory. AMD e.g. was advertising the HX3D with 4% to 53% higher performance in 1080p high settings.
The Dragon Range series still uses a chiplet design with two CCD-clusters (each with 8 possible cores) in 5nm and an IO-die (including the memory controller and the Radeon 610M iGPU) in 6nm. The chip integrates 4x USB 3.2 Gen2 (10 Gbps) ports (no USB4), 28 PCIe 5.0 lanes (for GPU and SSDs) and a dual-channel DDR5-5200 memory controller.
The R9 7945HX3D is rated at a TDP of 55 Watt and can be configured up to 75 Watt (cTDP).
- Range of benchmark values for this graphics card - Average benchmark values for this graphics card * Smaller numbers mean a higher performance 1 This benchmark is not used for the average calculation
v1.34
log 21. 00:22:06
#0 ran 0s before starting gpusingle class +0s ... 0s
#1 checking url part for id 17464 +0s ... 0s
#2 checking url part for id 14936 +0s ... 0s
#3 checking url part for id 15073 +0s ... 0s
#4 not redirecting to Ajax server +0s ... 0s
#5 did not recreate cache, as it is less than 5 days old! Created at Sun, 19 Oct 2025 05:20:51 +0200 +0s ... 0s
#6 composed specs +0.007s ... 0.007s
#7 did output specs +0s ... 0.007s
#8 getting avg benchmarks for device 17464 +0.001s ... 0.008s
#9 got single benchmarks 17464 +0.005s ... 0.013s
#10 getting avg benchmarks for device 14936 +0.004s ... 0.017s
#11 got single benchmarks 14936 +0.017s ... 0.034s
#12 getting avg benchmarks for device 15073 +0.003s ... 0.038s
#13 got single benchmarks 15073 +0.004s ... 0.042s
#14 got avg benchmarks for devices +0s ... 0.042s
#15 min, max, avg, median took s +0.063s ... 0.105s