Notebookcheck Logo

AMD Ryzen 9 7845HX vs AMD Ryzen 9 7840HX vs AMD Ryzen 9 7945HX

AMD Ryzen 9 7845HX

► remove from comparison AMD R9 7845HX

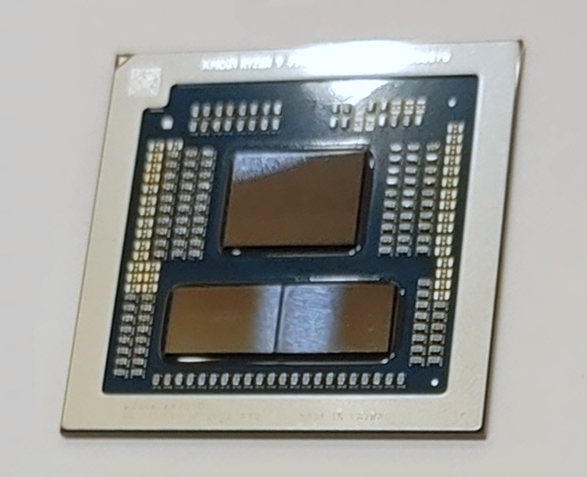
The AMD Ryzen 9 7845HX is a fast high-end laptop processor of the Dragon Range series. It offers 12 of the 16 cores based on the Zen 4 architecture that supports hyperthreading (24 threads). The cores clock from 3 (base) up to 5.2 GHz (single core boost). The 7845HX is the second-fastest mobile Ryzen CPU at launch and derived from the desktop Ryzen 9 7900X.

The Dragon Range series still uses a chiplet design with two CCD-clusters (each with 8 possible cores) in 5nm and an IO-die (including the memory controller and the Radeon 610M iGPU) in 6nm. The chip integrates 4x USB 3.2 Gen2 (10 Gbps) ports (no USB4), 28 PCIe 5.0 lanes (for GPU and SSDs) and a dual-channel DDR5-5200 memory controller.

Performance

The average 7845HX in our database is in the same league as the Core i9-13900HX, as far as multi-thread benchmark scores are concerned. This is a super-fast chip, as of mid 2023; of course, your mileage may vary depending on how competent the cooling solution of your laptop is and how high the CPU power limits are.

The R9 7845HX is rated at a TDP of 55 Watt and can be configured from 45 to 75 Watt (cTDP).

AMD Ryzen 9 7840HX

► remove from comparison AMD R9 7840HX

The AMD Ryzen 9 7840HX is a high-end notebook processor from the Dragon Range series with 12 cores and hyperthreading (SMT), which means it can process up to 24 threads simultaneously. The CPU uses the current Zen 4 architecture for the 12 cores and clocks these from 2.9 GHz (base clock) up to 5.1 GHz (single-core boost). The CPU offers 12 MB L2 cache and 64 MB L3 cache (i.e. a total of 76 MB cache). The 7840X consists of three chiplets, two CCD clusters with a maximum of 8 CPU cores on 5nm (71mm²) and one IO die on 6nm (122mm²) which are all manufactured by TSMC.

The performance of the Ryzen 9 should be significantly faster than the old Ryzen 9 6980HX (top model Rembrandt H, 8 cores, max 5 GHz). This is achieved by the additional cores, higher clock rate and improved architecture. Compared to the one year older Ryzen 9 7845HX, the 7840HX is clocked 100 MHz lower.

The chip also integrates 4x USB 3.2 Gen2 (10 Gbps) ports (no USB 4), 28 PCIe 5.0 lanes (for GPUs and SSDs), a dual-channel DDR5-5200 memory controller and a small AMD Radeon 610M graphics card (2CUs, 400 - 2200 MHz).

The R9 7840HX is specified with 55 watts TDP and can be configured from 45 to 75 watts (cTDP).

AMD Ryzen 9 7945HX

► remove from comparison AMD R9 7945HX

The AMD Ryzen 9 7945HX is a fast high-end laptop processor of the Dragon Range series. It offers 16 cores based on the Zen 4 architecture that supports hyperthreading (32 threads). The cores clock from 2.5 (base) up to 5.4 GHz (single core boost). The 7945HX is the fastest mobile Ryzen CPU at launch and derived from the desktop Ryzen 9 7950X.

The Dragon Range series still uses a chiplet design with two CCD-clusters (each with 8 possible cores) in 5nm and an IO-die (including the memory controller and the Radeon 610M iGPU) in 6nm. The chip integrates 4x USB 3.2 Gen2 (10 Gbps) ports (no USB4), 28 PCIe 5.0 lanes (for GPU and SSDs) and a dual-channel DDR5-5200 memory controller.

Performance

The Ryzen 9 7945HX is among the fastest processors in our database, as of August 2023. It is in the same league as the Ryzen 9 7945HX3D and noticeably ahead of the Core i9-13980HX, as far as multi-thread benchmark scores are concerned. It is outrageously, unbelievably fast, and those fortunate enough to purchase a laptop built around this CPU will have no performance issues for at least three years.

Thanks to its powerful cooling solution and a long-term CPU power limit of 128 W, the ROG Strix Scar 17 G733PY-XS96 is one of the fastest laptops built around the 7945HX that we know of.

The R9 7945HX is rated at a TDP of 55 Watt and can be configured up to 75 Watt (cTDP).

ModelAMD Ryzen 9 7845HXAMD Ryzen 9 7840HXAMD Ryzen 9 7945HX
CodenameDragon Range-HX (Zen 4)Dragon Range-HX (Zen 4)Dragon Range-HX (Zen 4)
SeriesAMD Dragon Range (Zen 4, Ryzen 7X4X/8X4X)AMD Dragon Range (Zen 4, Ryzen 7X4X/8X4X)AMD Dragon Range (Zen 4, Ryzen 7X4X/8X4X)
Series: Dragon Range (Zen 4, Ryzen 7X4X/8X4X) Dragon Range-HX (Zen 4)
AMD Ryzen 9 7945HX3D2.3 - 5.4 GHz16 / 32 cores128 MB L3
AMD Ryzen 9 7945HX2.5 - 5.4 GHz16 / 32 cores64 MB L3
AMD Ryzen 9 7940HX2.4 - 5.2 GHz16 / 32 cores64 MB L3
AMD Ryzen 9 7845HX « 3 - 5.2 GHz12 / 24 cores64 MB L3
AMD Ryzen 9 7840HX2.9 - 5.1 GHz12 / 24 cores64 MB L3
AMD Ryzen 9 7945HX3D2.3 - 5.4 GHz16 / 32 cores128 MB L3
AMD Ryzen 9 7945HX2.5 - 5.4 GHz16 / 32 cores64 MB L3
AMD Ryzen 9 7940HX2.4 - 5.2 GHz16 / 32 cores64 MB L3
AMD Ryzen 9 7845HX3 - 5.2 GHz12 / 24 cores64 MB L3
AMD Ryzen 9 7840HX « 2.9 - 5.1 GHz12 / 24 cores64 MB L3
AMD Ryzen 9 7945HX3D2.3 - 5.4 GHz16 / 32 cores128 MB L3
AMD Ryzen 9 7945HX « 2.5 - 5.4 GHz16 / 32 cores64 MB L3
AMD Ryzen 9 7940HX2.4 - 5.2 GHz16 / 32 cores64 MB L3
AMD Ryzen 9 7845HX3 - 5.2 GHz12 / 24 cores64 MB L3
AMD Ryzen 9 7840HX2.9 - 5.1 GHz12 / 24 cores64 MB L3
Clock3000 - 5200 MHz2900 - 5100 MHz2500 - 5400 MHz
L1 Cache768 KB768 KB1 MB
L2 Cache12 MB12 MB16 MB
L3 Cache64 MB64 MB64 MB
Cores / Threads12 / 24
12 x 5.2 GHz AMD Zen 4
12 / 24
12 x 5.1 GHz AMD Zen 4
16 / 32
16 x 5.4 GHz AMD Zen 4
TDP55 Watt55 Watt55 Watt
Transistors9900 Million9900 Million9900 Million
TechnologyCCD = 5 nm, I/O = 6 nm5 nmCCD = 5 nm, I/O = 6 nm
max. Temp.100 °C100 °C100 °C
SocketFL1FL1FL1
FeaturesDDR5-5200 RAM, PCIe 5, MMX, SSE, SSE2, SSE3, SSSE3, SSE4A, SSE4.1, SSE4.2, AVX, AVX2, AVX-512, BMI2, ABM, FMA, ADX, SMEP, SMAP, SMT, CPB, AES-NI, RDRAND, RDSEED, SHA, SMEDDR5-5200 RAM, PCIe 5, MMX, SSE, SSE2, SSE3, SSSE3, SSE4A, SSE4.1, SSE4.2, AVX, AVX2, AVX-512, BMI2, ABM, FMA, ADX, SMEP, SMAP, SMT, CPB, AES-NI, RDRAND, RDSEED, SHA, SMEDDR5-5200 RAM, PCIe 5, MMX, SSE, SSE2, SSE3, SSSE3, SSE4A, SSE4.1, SSE4.2, AVX, AVX2, AVX-512, BMI2, ABM, FMA, ADX, SMEP, SMAP, SMT, CPB, AES-NI, RDRAND, RDSEED, SHA, SME
iGPUAMD Radeon 610M (400 - 2200 MHz)AMD Radeon 610M (400 - 2200 MHz)AMD Radeon 610M (400 - 2200 MHz)
Architecturex86x86x86
Announced
Manufacturerwww.amd.comwww.amd.comwww.amd.com

Benchmarks

Performance Rating - CB R15 + R20 + 7-Zip + X265 + Blender + 3DM11 CPU - R9 7845HX
44.2 pt (74%)
Restrict / Search: Model: Max. age: years
Performance Rating - CB R15 + R20 + 7-Zip + X265 + Blender + 3DM11 CPU - R9 7945HX
46.9 pt (78%)
Restrict / Search: Model: Max. age: years
Cinebench 2024 - Cinebench 2024 CPU Single Core
min: 109.6     avg: 113     median: 113.6 (64%)     max: 116 Points
Cinebench 2024 - Cinebench 2024 CPU Multi Core
min: 1677     avg: 1739     median: 1716 (32%)     max: 1828 Points
Cinebench R23 - Cinebench R23 Multi Core
26876 Points (25%)
min: 30783     avg: 33078     median: 33459 (31%)     max: 34613 Points
Cinebench R23 - Cinebench R23 Single Core
1852 Points (79%)
min: 1861     avg: 1919     median: 1940 (82%)     max: 1957 Points
Cinebench R20 - Cinebench R20 CPU (Single Core)
719 Points (80%)
min: 712     avg: 742     median: 753 (83%)     max: 760 Points
Cinebench R20 - Cinebench R20 CPU (Multi Core)
10492 Points (26%)
min: 10025     avg: 12651     median: 13057 (32%)     max: 13769 Points
Cinebench R15 - Cinebench R15 CPU Multi 64 Bit
4320 Points (27%)
min: 4998     avg: 5363     median: 5289 (33%)     max: 5663 Points
Cinebench R15 - Cinebench R15 CPU Single 64 Bit
295 Points (83%)
min: 290     avg: 304.3     median: 308 (87%)     max: 311 Points
Cinebench R11.5 - Cinebench R11.5 CPU Multi 64 Bit
min: 59.93     avg: 61.6     median: 61 (79%)     max: 64.29 Points
Cinebench R11.5 - Cinebench R11.5 CPU Single 64 Bit
min: 3.65     avg: 3.7     median: 3.7 (87%)     max: 3.67 Points
Cinebench R10 - Cinebench R10 Rend. Single (32bit)
min: 8262     avg: 8390     median: 8408.5 (51%)     max: 8481 Points
Cinebench R10 - Cinebench R10 Rend. Multi (32bit)
min: 68510     avg: 70846     median: 71596.5 (52%)     max: 71681 Points
Cinebench R10 - Cinebench R10 Rend. Multi (64bit)
min: 127197     avg: 128938     median: 128360 (82%)     max: 131256 Points
Cinebench R10 - Cinebench R10 Rend. Single (64bit)
min: 15601     avg: 15764     median: 15801 (19%)     max: 15889 Points
wPrime 2.10 - wPrime 2.0 1024m *
min: 34.561     avg: 66.2     median: 35.8 (0%)     max: 158.7 s
wPrime 2.10 - wPrime 2.0 32m *
min: 1.917     avg: 2.7     median: 2.1 (0%)     max: 4.9 s
WinRAR - WinRAR 4.0
min: 10253     avg: 13106     median: 13822 (22%)     max: 15242 Points
7-Zip 18.03 - 7-Zip 18.03 Multi Thread 4 runs
106033 MIPS (61%)
min: 123364     avg: 135923     median: 139757 (80%)     max: 140932 MIPS
7-Zip 18.03 - 7-Zip 18.03 Single Thread 4 runs
7018 MIPS (83%)
min: 7319     avg: 7468     median: 7381 (87%)     max: 7711 MIPS
X264 HD Benchmark 4.0 - x264 Pass 2
min: 228     avg: 236.7     median: 239 (80%)     max: 243 fps
X264 HD Benchmark 4.0 - x264 Pass 1
min: 360.5     avg: 366.5     median: 362 (84%)     max: 377 fps
HWBOT x265 Benchmark v2.2 - HWBOT x265 4k Preset
29.7 fps (52%)
min: 33.8     avg: 35.8     median: 35.4 (62%)     max: 37.6 fps
TrueCrypt - TrueCrypt Serpent
min: 2.6     avg: 2.7     median: 2.7 (78%)     max: 2.7 GB/s
TrueCrypt - TrueCrypt Twofish
min: 4     avg: 4.1     median: 4.1 (71%)     max: 4.2 GB/s
TrueCrypt - TrueCrypt AES
min: 25.3     avg: 27.7     median: 27.7 (72%)     max: 29.9 GB/s
Blender - Blender 3.3 Classroom CPU *
185 Seconds (2%)
min: 138     avg: 151.4     median: 152 (2%)     max: 160 Seconds
Blender - Blender 2.79 BMW27 CPU *
117 Seconds (1%)
min: 87     avg: 95     median: 95 (1%)     max: 100 Seconds
R Benchmark 2.5 - R Benchmark 2.5 *
0.4 sec (9%)
min: 0.3884     avg: 0.4     median: 0.4 (9%)     max: 0.4159 sec
3DMark 06 - CPU - 3DMark 06 - CPU
min: 19481     avg: 19804     median: 19820 (42%)     max: 20110 Points
Super Pi mod 1.5 XS 1M - Super Pi mod 1.5 XS 1M *
min: 6.4     avg: 6.8     median: 6.6 (1%)     max: 7.49 s
Super Pi mod 1.5 XS 2M - Super Pi mod 1.5 XS 2M *
min: 13.9     avg: 14.6     median: 14.2 (1%)     max: 15.978 s
Super Pi Mod 1.5 XS 32M - Super Pi mod 1.5 XS 32M *
min: 336.106     avg: 339.6     median: 337 (1%)     max: 345.75 s
3DMark Vantage - 3DM Vant. Perf. CPU no Physx
min: 97328     avg: 100508     median: 100877 (77%)     max: 102949 Points
3DMark 11 - 3DM11 Performance Physics
22073 Points (55%)
min: 24017     avg: 26697     median: 26667 (66%)     max: 30404 Points
3DMark - 3DMark Ice Storm Physics
min: 79423     avg: 82378     median: 82128.5 (67%)     max: 86375 Points
3DMark - 3DMark Ice Storm Extreme Physics
min: 79397     avg: 82262     median: 81750 (66%)     max: 86844 Points
3DMark - 3DMark Ice Storm Unlimited Physics
min: 81621     avg: 84162     median: 83710 (69%)     max: 89010 Points
3DMark - 3DMark Cloud Gate Physics
min: 22457     avg: 23233     median: 23020 (58%)     max: 24017 Points
3DMark - 3DMark Fire Strike Standard Physics
36557 Points (65%)
min: 29626     avg: 38324     median: 39095 (70%)     max: 42342 Points
3DMark - 3DMark Time Spy CPU
11961 Points (50%)
min: 6283     avg: 12174     median: 12954.5 (55%)     max: 13694 Points
Geekbench 6.4 - Geekbench 6.4 Single-Core
2729 Points (68%)
2709 Points (68%)
min: 2797     avg: 2870     median: 2876 (72%)     max: 2940 Points
Geekbench 6.4 - Geekbench 6.4 Multi-Core
12585 Points (49%)
14822 Points (58%)
min: 16223     avg: 16828     median: 16765 (65%)     max: 17892 Points
Geekbench 6.0 - Geekbench 6.0 Single-Core
min: 2800     avg: 3003     median: 3105 (99%)     max: 3105 Points
Geekbench 6.0 - Geekbench 6.0 Multi-Core
min: 16132     avg: 19379     median: 21003 (86%)     max: 21003 Points
Geekbench 5.5 - Geekbench 5.1 - 5.5 64 Bit Single-Core
2008 Points (78%)
min: 1960     avg: 2088     median: 2103 (82%)     max: 2158 Points
Geekbench 5.5 - Geekbench 5.1 - 5.5 64 Bit Multi-Core
15068 Points (27%)
min: 18372     avg: 19614     median: 19745 (35%)     max: 20394 Points
Geekbench 5.0 - Geekbench 5.0 64 Bit Single-Core
min: 1882     avg: 2002     median: 2014.5 (9%)     max: 2095 Points
Geekbench 5.0 - Geekbench 5.0 64 Bit Multi-Core
min: 19315     avg: 19802     median: 19649.5 (62%)     max: 20593 Points
Geekbench 4.4 - Geekbench 4.1 - 4.4 64 Bit Single-Core
min: 7646     avg: 8264     median: 8534 (85%)     max: 8613 Points
Geekbench 4.4 - Geekbench 4.1 - 4.4 64 Bit Multi-Core
min: 75652     avg: 77236     median: 76265 (76%)     max: 79791 Points
Mozilla Kraken 1.1 - Kraken 1.1 Total Score *
475 ms (1%)
min: 446     avg: 460.3     median: 457.5 (1%)     max: 479 ms
Octane V2 - Octane V2 Total Score
min: 92275     avg: 96361     median: 97339 (75%)     max: 99470 Points
WebXPRT 4 - WebXPRT 4 Score
282 Points (77%)
min: 259     avg: 285.9     median: 289 (79%)     max: 295 Points
WebXPRT 3 - WebXPRT 3 Score
357 Points (64%)
min: 311     avg: 347.1     median: 351 (63%)     max: 387 Points
CrossMark - CrossMark Overall
1992 Points (74%)
min: 1929     avg: 2067     median: 2061 (77%)     max: 2240 Points
Power Consumption - Prime95 Power Consumption - external Monitor *
190.6 Watt (33%)
min: 134.4     avg: 163     median: 145 (25%)     max: 225 Watt
Power Consumption - Cinebench R15 Multi Power Consumption - external Monitor *
207 Watt (38%)
min: 139.1     avg: 173.2     median: 166.1 (30%)     max: 221 Watt
Power Consumption - Idle Power Consumption - external Monitor *
39.7 Watt (26%)
min: 13.9     avg: 38.7     median: 31.2 (21%)     max: 71.2 Watt
Power Consumption - Idle Power Consumption 150cd 1min *
41.9 Watt (46%)
min: 17.1     avg: 27     median: 24.1 (27%)     max: 37 Watt
Power Consumption - Power Efficiency - Cinebench R15 Multi external Monitor
20.9 Points per Watt (16%)
min: 25.1     avg: 31.3     median: 30.2 (23%)     max: 38 Points per Watt

Average Benchmarks AMD Ryzen 9 7845HX → 100% n=2

Average Benchmarks AMD Ryzen 9 7840HX → 109% n=2

Average Benchmarks AMD Ryzen 9 7945HX → 119% n=2

- Range of benchmark values for this graphics card
red legend - Average benchmark values for this graphics card
* Smaller numbers mean a higher performance
1 This benchmark is not used for the average calculation

v1.33
log 29. 21:02:22

#0 ran 0s before starting gpusingle class +0s ... 0s

#1 checking url part for id 14938 +0s ... 0s

#2 checking url part for id 17468 +0s ... 0s

#3 checking url part for id 14936 +0s ... 0s

#4 not redirecting to Ajax server +0s ... 0s

#5 did not recreate cache, as it is less than 5 days old! Created at Mon, 28 Apr 2025 05:16:39 +0200 +0s ... 0s

#6 composed specs +0.004s ... 0.004s

#7 did output specs +0s ... 0.004s

#8 getting avg benchmarks for device 14938 +0.001s ... 0.005s

#9 got single benchmarks 14938 +0.001s ... 0.006s

#10 getting avg benchmarks for device 17468 +0.001s ... 0.006s

#11 got single benchmarks 17468 +0s ... 0.007s

#12 getting avg benchmarks for device 14936 +0.001s ... 0.008s

#13 got single benchmarks 14936 +0.002s ... 0.01s

#14 got avg benchmarks for devices +0s ... 0.01s

#15 min, max, avg, median took s +0.022s ... 0.033s

#16 return log +0s ... 0.033s

Please share our article, every link counts!
Mail Logo
> Expert Reviews and News on Laptops, Smartphones and Tech Innovations > Benchmarks / Tech > Processor Comparison - Head 2 Head
Redaktion, 2017-09- 8 (Update: 2023-07- 1)