AMD Ryzen 7 5825U ► remove from comparison The AMD Ryzen 7 5825U is a processor for thin and light laptops based on the Cezanne generation. It is part of the "Barcelo" refresh in early 2022 and offers 100 MHz higher clocked CPU cores compared to the old Ryzen 7 5800U . The R7 5825U integrates all eight cores based on the Zen 3 microarchitecture and is the fastest U-series processor at launch. They are clocked at 2 (guaranteed base clock) to 4.5 GHz (Turbo) and support SMT / Hyperthreading (16 threads). The chip is manufactured on the modern 7 nm TSMC process.
The new Zen 3 microarchitecture offers a significantly higher IPC (instructions per clock) compared to Zen 2. For desktop processors AMD claims 19 percent on average and in applications reviews showed around 12% gains at the same clock speed.
Performance
The average 5825U in our database is in the same league as the Ryzen 7 7735U and the Core i7-1270P , as far as multi-thread benchmark scores are concerned. Which is a really good result, as of early 2023.
Thanks to its decent cooling solution and a long-term CPU power limit of 37 W, the 2022 Envy x360 15 is among the fastest laptops built around the 5825U that we know of. It can be more than 15% faster in CPU-bound workloads than the slowest system featuring the same chip in our database, as of August 2023.
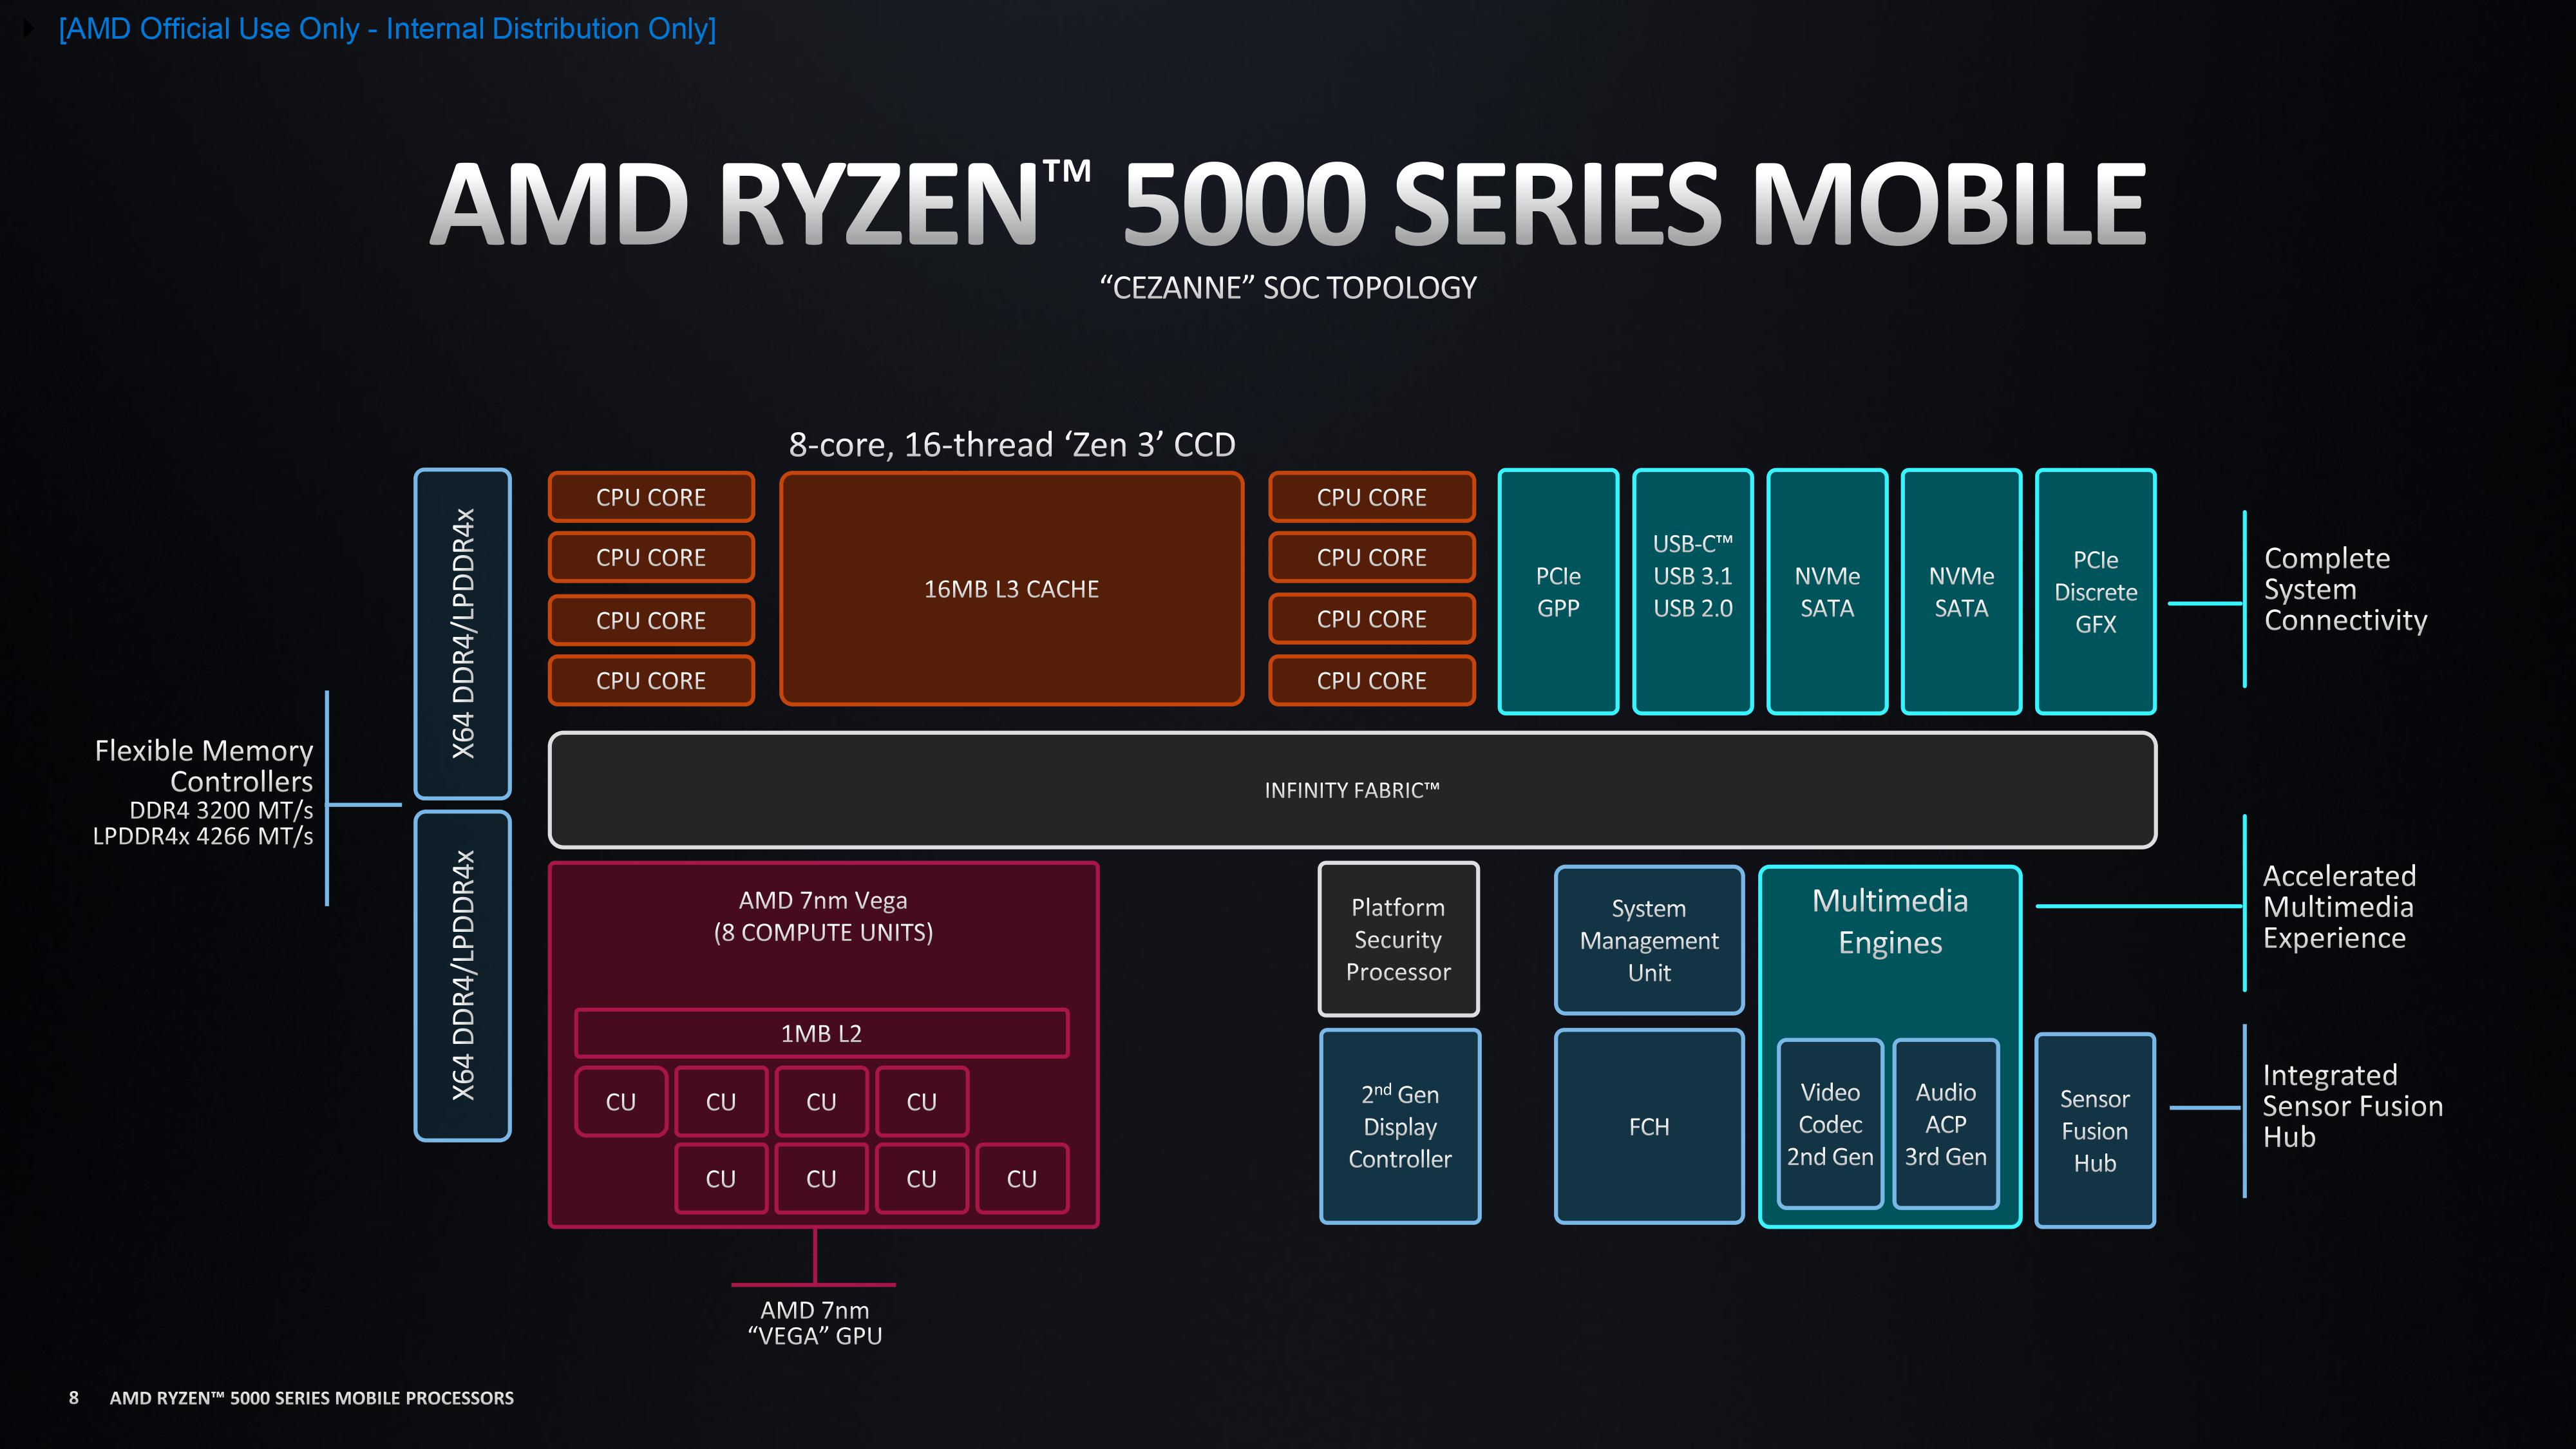
In addition to the eight CPU cores, the APU also integrates a Radeon RX Vega 8 GPU with 8 CUs at up to 2000 MHz. The dual channel memory controller supports DDR4-3200 and energy efficient LPDDR4-4266 RAM. Furthermore, 16 MB level 3 cache (up from 8 MB at the 4800U) can be found on the chip.
The TDP of the APU is specified at 15 Watt (default) and can be configured from 10 to 25 Watt by the laptop vendor (most chips are configured higher than 15 Watt). That means the chip is intended for thin and light laptops (but with fans).
AMD Ryzen 5 7430U ► remove from comparison The AMD Ryzen 5 7430U is a processor for thin and light laptops based on the Cezanne generation. It is part of the second "Barcelo" refresh and was announced in Q4 2023. The processor is identical to the old AMD Ryzen 5 5625U .
The SoC integrates six of the eight cores based on the Zen 3 microarchitecture that are clocked at 2.3 (guaranteed base clock) to 4.3 GHz (Turbo) and support SMT for a total of 12 threads. The chip is manufactured on the older 7 nm TSMC process.
In addition to the six CPU cores, the APU also integrates a Radeon RX Vega 7 integrated graphics card (now only called Radeon Graphics) with 7 CUs at up to 1800 MHz. The dual channel memory controller supports DDR4-3200 and energy efficient LPDDR4-4266 RAM. Furthermore, 16 MB level 3 cache (up from 8 MB at the 4800U) can be found on the chip.
Performance
The performance is identical to the old Ryzen 5625U and therefore in the lower mid range of laptop CPUs in late 2023.
Your mileage may vary depending on how high the CPU power limits are and how competent the cooling solution of your system is.
Power consumption
This Ryzen has a default TDP of 15 W (also known as the Power Limit 1). Which is a little too high to allow for passively cooled designs.
Model AMD Ryzen 7 5825U AMD Ryzen 5 7430U Codename Barcelo-U (Zen 3) Barcelo-U (Zen 3) Series AMD Cezanne (Zen 3, Ryzen 5000) AMD Cezanne (Zen 3, Ryzen 5000) Series: Cezanne (Zen 3, Ryzen 5000) Barcelo-U (Zen 3) Clock 2000 - 4500 MHz 2300 - 4300 MHz L1 Cache 512 KB 384 KB L2 Cache 4 MB 3 MB L3 Cache 16 MB 16 MB Cores / Threads 8 / 16 6 / 12 TDP 15 Watt 15 Watt Technology 7 nm 7 nm max. Temp. 95 °C 95 °C Socket FP6 FP6 Features DDR4-3200/LPDDR4x-4266 RAM (incl. ECC), PCIe 3, MMX, SSE, SSE2, SSE3, SSSE3, SSE4A, SSE4.1, SSE4.2, AVX, AVX2, BMI2, ABM, FMA, ADX, SMEP, SMAP, SMT, CPB, AES-NI, RDRAND, RDSEED, SHA, SME DDR4-3200/LPDDR4x-4266 RAM (incl. ECC), PCIe 3, MMX, SSE, SSE2, SSE3, SSSE3, SSE4A, SSE4.1, SSE4.2, AVX, AVX2, BMI2, ABM, FMA, ADX, SMEP, SMAP, SMT, CPB, AES-NI, RDRAND, RDSEED, SHA, SME iGPU AMD Radeon RX Vega 8 (Ryzen 4000/5000) ( - 2000 MHz)AMD Radeon RX Vega 7 ( - 1800 MHz)Architecture x86 x86 Announced Manufacturer www.amd.com www.amd.com
Performance Rating - CB R15 + R20 + 7-Zip + X265 + Blender + 3DM11 CPU - R7 5825U
Performance Rating - CB R15 + R20 + 7-Zip + X265 + Blender + 3DM11 CPU - R5 7430U
Cinebench 2024 - Cinebench 2024 CPU Single Core
Model CPU GPU RAM Value Ninkear A15-Pro16+1TB R5 7430U 30 W / 15 W Vega 7 16 GB 82
Cinebench 2024 - Cinebench 2024 CPU Multi Core
Model CPU GPU RAM Value Ninkear A15-Pro16+1TB R5 7430U 30 W / 15 W Vega 7 16 GB 395
Cinebench R23 - Cinebench R23 Multi Core
min: 9339 avg: 10179 median: 10152 (9%) max: 10904 Points
CPU TDP ? TDP 10 W TDP 15 W TDP 30 W TDP 37 W 86% 93% 93% 95% 100%
Model CPU GPU RAM Value Ninkear A15-Pro16+1TB R5 7430U 30 W / 15 W Vega 7 16 GB 7477
CPU TDP ? TDP 10 W TDP 15 W TDP 30 W TDP 37 W 86% 93% 81% 95% 100%
Cinebench R23 - Cinebench R23 Single Core
min: 1433 avg: 1448 median: 1452 (61%) max: 1460 Points
CPU TDP ? TDP 10 W TDP 15 W TDP 30 W TDP 37 W 99% 99% 100% 98% 100%
Model CPU GPU RAM Value Ninkear A15-Pro16+1TB R5 7430U 30 W / 15 W Vega 7 16 GB 1382
CPU TDP ? TDP 10 W TDP 15 W TDP 30 W TDP 37 W 99% 99% 97% 98% 100%
Cinebench R20 - Cinebench R20 CPU (Single Core)
min: 547 avg: 559 median: 565 (62%) max: 567 Points
CPU TDP ? TDP 10 W TDP 15 W TDP 30 W TDP 37 W 96% 100% 100% 96% 100%
Model CPU GPU RAM Value Ninkear A15-Pro16+1TB R5 7430U 30 W / 15 W Vega 7 16 GB 538
CPU TDP ? TDP 10 W TDP 15 W TDP 30 W TDP 37 W 96% 100% 97% 96% 100%
Cinebench R20 - Cinebench R20 CPU (Multi Core)
min: 3645 avg: 3954 median: 3973 (10%) max: 4180 Points
CPU TDP ? TDP 10 W TDP 15 W TDP 30 W TDP 37 W 87% 95% 94% 97% 100%
Model CPU GPU RAM Value Ninkear A15-Pro16+1TB R5 7430U 30 W / 15 W Vega 7 16 GB 2899
CPU TDP ? TDP 10 W TDP 15 W TDP 30 W TDP 37 W 87% 95% 82% 97% 100%
Cinebench R15 - Cinebench R15 CPU Multi 64 Bit
min: 1575 avg: 1736 median: 1757 (11%) max: 1860 Points
CPU TDP ? TDP 10 W TDP 15 W TDP 30 W TDP 37 W 85% 97% 91% 94% 100%
Model CPU GPU RAM Value Ninkear A15-Pro16+1TB R5 7430U 30 W / 15 W Vega 7 16 GB 1265
CPU TDP ? TDP 10 W TDP 15 W TDP 30 W TDP 37 W 85% 97% 79% 94% 100%
Cinebench R15 - Cinebench R15 CPU Single 64 Bit
min: 228 avg: 231.6 median: 232 (64%) max: 235 Points
CPU TDP ? TDP 10 W TDP 15 W TDP 30 W TDP 37 W 99% 98% 100% 97% 99%
Model CPU GPU RAM Value Ninkear A15-Pro16+1TB R5 7430U 30 W / 15 W Vega 7 16 GB 223
CPU TDP ? TDP 10 W TDP 15 W TDP 30 W TDP 37 W 100% 100% 99% 98% 100%
Cinebench R11.5 - Cinebench R11.5 CPU Multi 64 Bit
min: 18.56 avg: 19.1 median: 19.1 (25%) max: 19.72 Points
CPU TDP 10 W TDP 15 W 94% 100%
Model CPU GPU RAM Value Ninkear A15-Pro16+1TB R5 7430U 30 W / 15 W Vega 7 16 GB 16.15
CPU TDP 10 W TDP 15 W 100% 97%
Cinebench R11.5 - Cinebench R11.5 CPU Single 64 Bit
min: 2.75 avg: 2.8 median: 2.8 (66%) max: 2.78 Points
CPU TDP 10 W TDP 15 W 99% 100%
Model CPU GPU RAM Value Ninkear A15-Pro16+1TB R5 7430U 30 W / 15 W Vega 7 16 GB 2.66
CPU TDP 10 W TDP 15 W 100% 99%
Cinebench R10 - Cinebench R10 Rend. Single (32bit)
min: 6200 avg: 6252 median: 6252 (38%) max: 6304 Points
CPU TDP 10 W TDP 15 W 100% 98%
Model CPU GPU RAM Value Ninkear A15-Pro16+1TB R5 7430U 30 W / 15 W Vega 7 16 GB 5769
CPU TDP 10 W TDP 15 W 100% 95%
Cinebench R10 - Cinebench R10 Rend. Multi (32bit)
min: 32641 avg: 32965 median: 32964.5 (24%) max: 33288 Points
CPU TDP 10 W TDP 15 W 98% 100%
Model CPU GPU RAM Value Ninkear A15-Pro16+1TB R5 7430U 30 W / 15 W Vega 7 16 GB 29701
CPU TDP 10 W TDP 15 W 100% 96%
Cinebench R10 - Cinebench R10 Rend. Multi (64bit)
min: 59300 avg: 59732 median: 59731.5 (38%) max: 60163 Points
CPU TDP 10 W TDP 15 W 100% 99%
Model CPU GPU RAM Value Ninkear A15-Pro16+1TB R5 7430U 30 W / 15 W Vega 7 16 GB 52480
CPU TDP 10 W TDP 15 W 100% 93%
Cinebench R10 - Cinebench R10 Rend. Single (64bit)
min: 11823 avg: 11834 median: 11834 (14%) max: 11845 Points
CPU TDP 10 W TDP 15 W 100% 100%
Model CPU GPU RAM Value Ninkear A15-Pro16+1TB R5 7430U 30 W / 15 W Vega 7 16 GB 11106
CPU TDP 10 W TDP 15 W 100% 97%
wPrime 2.10 - wPrime 2.0 1024m *
min: 116.561 avg: 228.7 median: 228.7 (3%) max: 340.8 s
CPU TDP 10 W TDP 15 W 100% 103%
wPrime 2.10 - wPrime 2.0 32m *
min: 4.018 avg: 6.6 median: 6.6 (1%) max: 9.2 s
CPU TDP 10 W TDP 15 W 100% 101%
WinRAR - WinRAR 4.0
min: 5835 avg: 6637 median: 6637 (11%) max: 7439 Points
CPU TDP 10 W TDP 15 W 78% 100%
7-Zip 18.03 - 7-Zip 18.03 Multi Thread 4 runs
min: 42883 avg: 47619 median: 48177 (28%) max: 50524 MIPS
CPU TDP ? TDP 10 W TDP 15 W TDP 30 W TDP 37 W 85% 95% 100% 93% 98%
Model CPU GPU RAM Value Ninkear A15-Pro16+1TB R5 7430U 30 W / 15 W Vega 7 16 GB 36664
CPU TDP ? TDP 10 W TDP 15 W TDP 30 W TDP 37 W 87% 97% 88% 95% 100%
7-Zip 18.03 - 7-Zip 18.03 Single Thread 4 runs
min: 5208 avg: 5386 median: 5427 (64%) max: 5468 MIPS
CPU TDP ? TDP 10 W TDP 15 W TDP 30 W TDP 37 W 100% 100% 98% 95% 99%
Model CPU GPU RAM Value Ninkear A15-Pro16+1TB R5 7430U 30 W / 15 W Vega 7 16 GB 5134
CPU TDP ? TDP 10 W TDP 15 W TDP 30 W TDP 37 W 100% 100% 96% 95% 99%
X264 HD Benchmark 4.0 - x264 Pass 2
min: 98.05 avg: 99.2 median: 99.2 (33%) max: 100.3 fps
CPU TDP 10 W TDP 15 W 100% 98%
X264 HD Benchmark 4.0 - x264 Pass 1
min: 249.6 avg: 250.6 median: 250.6 (58%) max: 251.5 fps
CPU TDP 10 W TDP 15 W 99% 100%
HWBOT x265 Benchmark v2.2 - HWBOT x265 4k Preset
min: 11.1 avg: 12.4 median: 12.6 (22%) max: 13.4 fps
CPU TDP ? TDP 10 W TDP 15 W TDP 30 W TDP 37 W 83% 94% 90% 95% 100%
Model CPU GPU RAM Value Ninkear A15-Pro16+1TB R5 7430U 30 W / 15 W Vega 7 16 GB 9.25
CPU TDP ? TDP 10 W TDP 15 W TDP 30 W TDP 37 W 83% 94% 80% 95% 100%
TrueCrypt - TrueCrypt Serpent
CPU TDP 10 W TDP 15 W 100% 100%
TrueCrypt - TrueCrypt Twofish
min: 1.4 avg: 1.5 median: 1.5 (25%) max: 1.5 GB/s
CPU TDP 10 W TDP 15 W 100% 93%
TrueCrypt - TrueCrypt AES
min: 8.7 avg: 9.9 median: 9.9 (26%) max: 11 GB/s
CPU TDP 10 W TDP 15 W 79% 100%
Blender - Blender 3.3 Classroom CPU *
min: 486 avg: 539 median: 555 (7%) max: 567 Seconds
CPU TDP ? TDP 10 W TDP 15 W TDP 30 W TDP 37 W 100% 100% 100% 101% 101%
Model CPU GPU RAM Value Ninkear A15-Pro16+1TB R5 7430U 30 W / 15 W Vega 7 3.3.316 GB 753
CPU TDP ? TDP 10 W TDP 15 W TDP 30 W TDP 37 W 101% 101% 100% 102% 102%
Blender - Blender 2.79 BMW27 CPU *
min: 281 avg: 301 median: 297 (2%) max: 322 Seconds
CPU TDP ? TDP 10 W TDP 15 W TDP 30 W TDP 37 W 100% 100% 100% 100% 100%
Model CPU GPU RAM Value Ninkear A15-Pro16+1TB R5 7430U 30 W / 15 W Vega 7 16 GB 426
CPU TDP ? TDP 10 W TDP 15 W TDP 30 W TDP 37 W 100% 100% 100% 101% 101%
R Benchmark 2.5 - R Benchmark 2.5 *
min: 0.515 avg: 0.5 median: 0.5 (11%) max: 0.536 sec
CPU TDP ? TDP 10 W TDP 15 W TDP 30 W TDP 37 W 100% 100% 100% 100% 101%
Model CPU GPU RAM Value Ninkear A15-Pro16+1TB R5 7430U 30 W / 15 W Vega 7 16 GB 0.555
CPU TDP ? TDP 10 W TDP 15 W TDP 30 W TDP 37 W 100% 100% 100% 100% 101%
3DMark 06 - CPU - 3DMark 06 - CPU
min: 11292 avg: 11671 median: 11670.5 (25%) max: 12049 Points
CPU TDP 10 W TDP 15 W 94% 100%
Model CPU GPU RAM Value Ninkear A15-Pro16+1TB R5 7430U 30 W / 15 W Vega 7 16 GB 9472
CPU TDP 10 W TDP 15 W 100% 95%
Super Pi mod 1.5 XS 1M - Super Pi mod 1.5 XS 1M *
min: 7.2 avg: 7.6 median: 7.6 (2%) max: 7.912 s
CPU TDP 10 W TDP 15 W 100% 100%
Super Pi mod 1.5 XS 2M - Super Pi mod 1.5 XS 2M *
min: 15.7 avg: 16.4 median: 16.4 (1%) max: 17.124 s
CPU TDP 10 W TDP 15 W 100% 100%
Super Pi Mod 1.5 XS 32M - Super Pi mod 1.5 XS 32M *
3DMark Vantage - 3DM Vant. Perf. CPU no Physx
Model CPU GPU RAM Value Ninkear A15-Pro16+1TB R5 7430U 30 W / 15 W Vega 7 16 GB 39288
3DMark 11 - 3DM11 Performance Physics
min: 10473 avg: 12841 median: 12620 (31%) max: 15153 Points
CPU TDP ? TDP 10 W TDP 15 W TDP 30 W TDP 37 W 69% 90% 100% 81% 83%
Model CPU GPU RAM Value Ninkear A15-Pro16+1TB R5 7430U 30 W / 15 W Vega 7 16 GB 11433
CPU TDP ? TDP 10 W TDP 15 W TDP 30 W TDP 37 W 77% 100% 98% 91% 93%
3DMark - 3DMark Ice Storm Physics
Model CPU GPU RAM Value Ninkear A15-Pro16+1TB R5 7430U 30 W / 15 W Vega 7 16 GB 69556
3DMark - 3DMark Ice Storm Extreme Physics
Model CPU GPU RAM Value Ninkear A15-Pro16+1TB R5 7430U 30 W / 15 W Vega 7 16 GB 69259
3DMark - 3DMark Ice Storm Unlimited Physics
Model CPU GPU RAM Value Ninkear A15-Pro16+1TB R5 7430U 30 W / 15 W Vega 7 16 GB 83219
3DMark - 3DMark Cloud Gate Physics
min: 13778 avg: 14930 median: 14798 (37%) max: 16247 Points
CPU TDP ? TDP 10 W TDP 15 W TDP 30 W TDP 37 W 85% 95% 89% 91% 100%
Model CPU GPU RAM Value Ninkear A15-Pro16+1TB R5 7430U 30 W / 15 W Vega 7 16 GB 10562
CPU TDP ? TDP 10 W TDP 15 W TDP 30 W TDP 37 W 85% 95% 77% 91% 100%
3DMark - 3DMark Fire Strike Standard Physics
min: 19642 avg: 20827 median: 20481 (37%) max: 22730 Points
CPU TDP ? TDP 10 W TDP 15 W TDP 30 W TDP 37 W 86% 90% 88% 94% 100%
Model CPU GPU RAM Value Ninkear A15-Pro16+1TB R5 7430U 30 W / 15 W Vega 7 16 GB 17496
CPU TDP ? TDP 10 W TDP 15 W TDP 30 W TDP 37 W 86% 90% 82% 94% 100%
3DMark - 3DMark Time Spy CPU
min: 5841 avg: 6534 median: 6520 (27%) max: 7124 Points
CPU TDP ? TDP 10 W TDP 15 W TDP 30 W TDP 37 W 82% 89% 100% 92% 96%
Model CPU GPU RAM Value Ninkear A15-Pro16+1TB R5 7430U 30 W / 15 W Vega 7 16 GB 4762
CPU TDP ? TDP 10 W TDP 15 W TDP 30 W TDP 37 W 86% 93% 87% 96% 100%
Geekbench 6.4 - Geekbench 6.4 Single-Core
min: 1852 avg: 1879 median: 1879 (47%) max: 1906 Points
CPU TDP ? TDP 15 W 99% 100%
Geekbench 6.4 - Geekbench 6.4 Multi-Core
min: 6142 avg: 6442 median: 6441.5 (25%) max: 6741 Points
CPU TDP ? TDP 15 W 91% 100%
Geekbench 6.0 - Geekbench 6.0 Single-Core
min: 1847 avg: 2476 median: 2476 (79%) max: 3105 Points
CPU TDP 15 W TDP 30 W 100% 59%
Model CPU GPU RAM Value Ninkear A15-Pro16+1TB R5 7430U 30 W / 15 W Vega 7 16 GB 3105
CPU TDP 15 W TDP 30 W 100% 59%
Geekbench 6.0 - Geekbench 6.0 Multi-Core
min: 6556 avg: 13780 median: 13779.5 (57%) max: 21003 Points
CPU TDP 15 W TDP 30 W 100% 31%
Model CPU GPU RAM Value Ninkear A15-Pro16+1TB R5 7430U 30 W / 15 W Vega 7 16 GB 21003
CPU TDP 15 W TDP 30 W 100% 31%
Geekbench 5.5 - Geekbench 5.1 - 5.5 64 Bit Single-Core
min: 1438 avg: 1481 median: 1482 (58%) max: 1520 Points
CPU TDP ? TDP 15 W TDP 30 W TDP 37 W 95% 100% 97% 98%
min: 1371 avg: 1395 median: 1394.5 (54%) max: 1418 Points
CPU TDP ? TDP 15 W TDP 30 W TDP 37 W 95% 97% 98% 100%
Geekbench 5.5 - Geekbench 5.1 - 5.5 64 Bit Multi-Core
min: 5827 avg: 7077 median: 7074.5 (13%) max: 8330 Points
CPU TDP ? TDP 15 W TDP 30 W TDP 37 W 70% 100% 81% 88%
min: 5831 avg: 5969 median: 5968.5 (11%) max: 6106 Points
CPU TDP ? TDP 15 W TDP 30 W TDP 37 W 81% 96% 92% 100%
Geekbench 5.0 - Geekbench 5.0 64 Bit Single-Core
min: 1447 avg: 1451 median: 1451 (6%) max: 1455 Points
CPU TDP 15 W TDP 37 W 99% 100%
Model CPU GPU RAM Value Ninkear A15-Pro16+1TB R5 7430U 30 W / 15 W Vega 7 16 GB 1344
CPU TDP 15 W TDP 37 W 96% 100%
Geekbench 5.0 - Geekbench 5.0 64 Bit Multi-Core
min: 7235 avg: 7750 median: 7749.5 (24%) max: 8264 Points
CPU TDP 15 W TDP 37 W 100% 88%
Model CPU GPU RAM Value Ninkear A15-Pro16+1TB R5 7430U 30 W / 15 W Vega 7 16 GB 5706
CPU TDP 15 W TDP 37 W 97% 100%
Geekbench 4.4 - Geekbench 4.1 - 4.4 64 Bit Single-Core
Model CPU GPU RAM Value Ninkear A15-Pro16+1TB R5 7430U 30 W / 15 W Vega 7 16 GB 5702
Geekbench 4.4 - Geekbench 4.1 - 4.4 64 Bit Multi-Core
Model CPU GPU RAM Value Ninkear A15-Pro16+1TB R5 7430U 30 W / 15 W Vega 7 16 GB 23754
Mozilla Kraken 1.1 - Kraken 1.1 Total Score *
min: 619 avg: 628 median: 623 (1%) max: 645 ms
CPU TDP ? TDP 10 W TDP 15 W TDP 30 W TDP 37 W 100% 100% 100% 100% 100%
Model CPU GPU RAM Value Ninkear A15-Pro16+1TB R5 7430U 30 W / 15 W Vega 7 Chrome 8216 GB 658
CPU TDP ? TDP 10 W TDP 15 W TDP 30 W TDP 37 W 100% 100% 100% 100% 100%
Octane V2 - Octane V2 Total Score
WebXPRT 4 - WebXPRT 4 Score
min: 207 avg: 217.8 median: 213 (59%) max: 242 Points
CPU TDP ? TDP 10 W TDP 15 W TDP 30 W TDP 37 W 86% 88% 88% 100% 88%
Model CPU GPU RAM Value Ninkear A15-Pro16+1TB R5 7430U 30 W / 15 W Vega 7 Chrome 105.0.0.016 GB 204
CPU TDP ? TDP 10 W TDP 15 W TDP 30 W TDP 37 W 86% 88% 86% 100% 88%
WebXPRT 3 - WebXPRT 3 Score
min: 239 avg: 260.2 median: 264 (47%) max: 275 Points
CPU TDP ? TDP 10 W TDP 15 W TDP 30 W TDP 37 W 96% 98% 92% 87% 100%
Model CPU GPU RAM Value Ninkear A15-Pro16+1TB R5 7430U 30 W / 15 W Vega 7 Chrome 8216 GB 239
CPU TDP ? TDP 10 W TDP 15 W TDP 30 W TDP 37 W 96% 98% 90% 87% 100%
CrossMark - CrossMark Overall
min: 1124 avg: 1293 median: 1324 (50%) max: 1387 Points
CPU TDP ? TDP 10 W TDP 15 W TDP 30 W TDP 37 W 81% 95% 100% 94% 96%
Model CPU GPU RAM Value Ninkear A15-Pro16+1TB R5 7430U 30 W / 15 W Vega 7 16 GB 1219
CPU TDP ? TDP 10 W TDP 15 W TDP 30 W TDP 37 W 85% 100% 98% 98% 100%
Power Consumption - Prime95 Power Consumption - external Monitor *
min: 34.6 avg: 44.5 median: 42.6 (7%) max: 54.3 Watt
CPU TDP ? TDP 10 W TDP 15 W TDP 30 W TDP 37 W 104% 103% 102% 100% 100%
Model CPU GPU RAM Value Ninkear A15-Pro16+1TB R5 7430U 30 W / 15 W Vega 7 16 GB 29.6
CPU TDP ? TDP 10 W TDP 15 W TDP 30 W TDP 37 W 104% 103% 103% 100% 100%
Power Consumption - Cinebench R15 Multi Power Consumption - external Monitor *
min: 37.3 avg: 47.1 median: 48.5 (9%) max: 54 Watt
CPU TDP ? TDP 10 W TDP 15 W TDP 37 W 103% 101% 101% 100%
Model CPU GPU RAM Value Ninkear A15-Pro16+1TB R5 7430U 30 W / 15 W Vega 7 16 GB 41.9
CPU TDP ? TDP 10 W TDP 15 W TDP 37 W 103% 101% 102% 100%
Power Consumption - Idle Power Consumption - external Monitor *
min: 2.81 avg: 4.6 median: 3.5 (2%) max: 8.73 Watt
CPU TDP ? TDP 10 W TDP 15 W TDP 30 W 104% 104% 100% 103%
Model CPU GPU RAM Value Ninkear A15-Pro16+1TB R5 7430U 30 W / 15 W Vega 7 16 GB 6.18
CPU TDP ? TDP 10 W TDP 15 W TDP 30 W 103% 103% 100% 103%
Power Consumption - Idle Power Consumption 150cd 1min *
min: 4.11 avg: 5.1 median: 4.8 (5%) max: 6.3 Watt
CPU TDP ? TDP 10 W TDP 30 W 103% 102% 100%
Model CPU GPU RAM Value Ninkear A15-Pro16+1TB R5 7430U 30 W / 15 W Vega 7 16 GB 9.95
CPU TDP ? TDP 10 W TDP 15 W TDP 30 W 107% 106% 100% 105%
Power Consumption - Power Efficiency - Cinebench R15 Multi external Monitor
min: 33.6 avg: 35.5 median: 34.4 (26%) max: 38.6 Points per Watt
CPU TDP 10 W TDP 15 W TDP 37 W 100% 87% 89%
30.2 Points per Watt (23%)
Model CPU GPU RAM Value Ninkear A15-Pro16+1TB R5 7430U 30 W / 15 W Vega 7 16 GB 30.2
CPU TDP 10 W TDP 15 W TDP 37 W 100% 83% 89%
Average Benchmarks AMD Ryzen 7 5825U → 100% n=43 Average Benchmarks AMD Ryzen 5 7430U → 88% n=43
- Range of benchmark values for this graphics card
- Average benchmark values for this graphics card
* Smaller numbers mean a higher performance
1 This benchmark is not used for the average calculation
log 23. 14:11:10
#0 ran 0s before starting gpusingle class +0s ... 0s
#1 checking url part for id 14092 +0s ... 0s
#2 checking url part for id 19320 +0s ... 0s
#3 not redirecting to Ajax server +0s ... 0s
#4 did not recreate cache, as it is less than 5 days old! Created at Fri, 22 Aug 2025 05:18:47 +0200 +0s ... 0s
#5 composed specs +0.006s ... 0.006s
#6 did output specs +0s ... 0.006s
#7 getting avg benchmarks for device 14092 +0.005s ... 0.011s
#8 got single benchmarks 14092 +0.011s ... 0.022s
#9 getting avg benchmarks for device 19320 +0.004s ... 0.026s
#10 got single benchmarks 19320 +0.005s ... 0.032s
#11 got avg benchmarks for devices +0s ... 0.032s
#12 min, max, avg, median took s +0.055s ... 0.087s
#13 return log +0.001s ... 0.088s