

NVIDIA Quadro P620 vs NVIDIA Quadro P1000 vs NVIDIA Quadro P3000 Max-Q
NVIDIA Quadro P620
► remove from comparison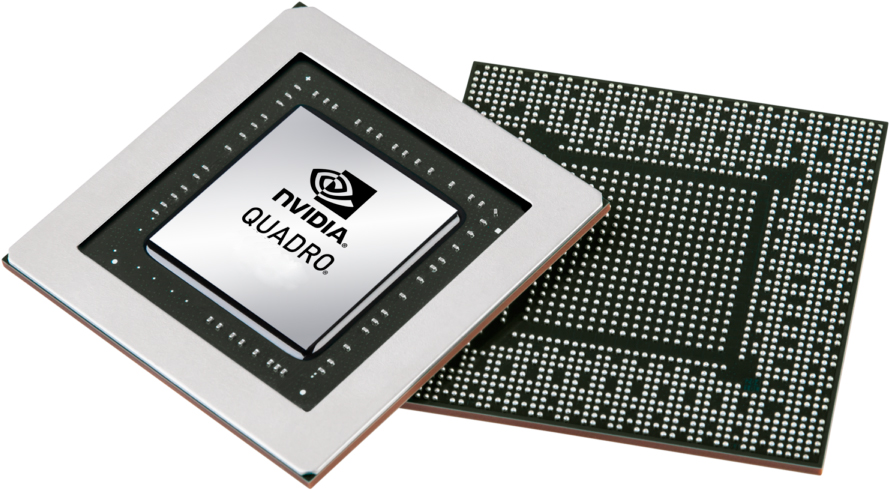
The Nvidia Quadro P620 is an entry-level mobile workstation graphics card for laptops. It uses a GP107 Pascal chip with a 128 Bit memory bus and therefore similar to the old Quadro P1000 with reduced clock speeds. Compared to consumer cards, there is no similar specified card currently and therefore the P620 slots in between the GeForce MX250 and GTX 1050. With a theoretical peak of 1.5 TFLOPS, the performance is clearly ahead of the old P600 with 1.2 TFLOPS.
The Quadro GPUs offer certified drivers, which are optimized for stability and performance in professional applications (CAD, DCC, medical, prospection, and visualizing applications). The performance in these areas is therefore much better compared to corresponding consumer GPUs.
NVIDIA Quadro P1000
► remove from comparisonThe Nvidia Quadro P1000 is a mobile entry-level workstation graphics card for notebooks. Similar to the consumer GeForce GTX 1050 (Laptop), it is based on the GP107 chip but offers only 512 shaders (1050 offers 640, 1050 Ti 768). The graphics card is designed for the Kaby Lake / Coffee Lake generation.
The Quadro GPUs offer certified drivers, which are optimized for stability and performance in professional applications (CAD, DCC, medical, prospection, and visualizing applications). The performance in these areas is therefore much better compared to corresponding consumer GPUs.
Performance
The theoretical performance should be below the GeForce GTX 1050 due to the lower shader count.
NVIDIA Quadro P3000 Max-Q
► remove from comparisonThe Nvidia Quadro P3000 Max-Q (official Nvidia Quadro P3000 with Max-Q Design) is a mobile high-end workstation graphics card for notebooks. Similar to the consumer GeForce GTX 1060 (Laptop), it is based on the GP106 chip with 1280 shaders. The graphics card is the more efficient version of the normal Quadro P3000 with slightly reduced clock speeds at a much reduced power consumption (60 Watt versus 75 Watt TGP).
The Quadro GPUs offer certified drivers, which are optimized for stability and performance in professional applications (CAD, DCC, medical, prospection, and visualizing applications). The performance in these areas is therefore much better compared to corresponding consumer GPUs.
Performance
The theoretical performance should be only slightly below the normal Quadro P3000 (as it was with the Max-Q GTX 1060 versus the normal GTX 1060).
| NVIDIA Quadro P620 | NVIDIA Quadro P1000 | NVIDIA Quadro P3000 Max-Q | ||||||||||||||||||||||||||||||||||||||||||||||||||||||||||||||||||||||||||||||||||||||||||||||||||||||||||||||||||||||
| Quadro P Series |
|
|
| |||||||||||||||||||||||||||||||||||||||||||||||||||||||||||||||||||||||||||||||||||||||||||||||||||||||||||||||||||||
| Architecture | Pascal | Pascal | Pascal | |||||||||||||||||||||||||||||||||||||||||||||||||||||||||||||||||||||||||||||||||||||||||||||||||||||||||||||||||||||
| Pipelines | 512 - unified | 512 - unified | 1280 - unified | |||||||||||||||||||||||||||||||||||||||||||||||||||||||||||||||||||||||||||||||||||||||||||||||||||||||||||||||||||||
| Core Speed | 1177 - 1442 (Boost) MHz | 1493 - 1519 (Boost) MHz | 1075 - 1240 (Boost) MHz | |||||||||||||||||||||||||||||||||||||||||||||||||||||||||||||||||||||||||||||||||||||||||||||||||||||||||||||||||||||
| Memory Speed | 6000 MHz | 6008 MHz | 7008 MHz | |||||||||||||||||||||||||||||||||||||||||||||||||||||||||||||||||||||||||||||||||||||||||||||||||||||||||||||||||||||
| Memory Bus Width | 128 Bit | 128 Bit | 192 Bit | |||||||||||||||||||||||||||||||||||||||||||||||||||||||||||||||||||||||||||||||||||||||||||||||||||||||||||||||||||||
| Memory Type | GDDR5 | GDDR5 | GDDR5 | |||||||||||||||||||||||||||||||||||||||||||||||||||||||||||||||||||||||||||||||||||||||||||||||||||||||||||||||||||||
| Max. Amount of Memory | 4 GB | 4 GB | 16 GB | |||||||||||||||||||||||||||||||||||||||||||||||||||||||||||||||||||||||||||||||||||||||||||||||||||||||||||||||||||||
| Shared Memory | no | no | no | |||||||||||||||||||||||||||||||||||||||||||||||||||||||||||||||||||||||||||||||||||||||||||||||||||||||||||||||||||||
| API | DirectX 12_1, OpenGL 4.5 | DirectX 12_1, Shader 5.0, OpenGL 4.6 | DirectX 12_1, Shader 5.0, OpenGL 4.5 | |||||||||||||||||||||||||||||||||||||||||||||||||||||||||||||||||||||||||||||||||||||||||||||||||||||||||||||||||||||
| Power Consumption | 25 Watt | 40 Watt | 60 Watt | |||||||||||||||||||||||||||||||||||||||||||||||||||||||||||||||||||||||||||||||||||||||||||||||||||||||||||||||||||||
| technology | 14 nm | 14 nm | 16 nm | |||||||||||||||||||||||||||||||||||||||||||||||||||||||||||||||||||||||||||||||||||||||||||||||||||||||||||||||||||||
| Features | Vulkan, Multi Monitor | Optimus, PhysX, 3D Vision Pro, nView, Optimus | Optimus, PhysX, 3D Vision Pro, nView, Optimus | |||||||||||||||||||||||||||||||||||||||||||||||||||||||||||||||||||||||||||||||||||||||||||||||||||||||||||||||||||||
| Notebook Size | large | large | large | |||||||||||||||||||||||||||||||||||||||||||||||||||||||||||||||||||||||||||||||||||||||||||||||||||||||||||||||||||||
| Date of Announcement | 27.05.2019 | 01.02.2017 | 01.09.2017 | |||||||||||||||||||||||||||||||||||||||||||||||||||||||||||||||||||||||||||||||||||||||||||||||||||||||||||||||||||||
| Transistors | 3.3 Billion | |||||||||||||||||||||||||||||||||||||||||||||||||||||||||||||||||||||||||||||||||||||||||||||||||||||||||||||||||||||||
| Link to Manufacturer Page | www.nvidia.com | |||||||||||||||||||||||||||||||||||||||||||||||||||||||||||||||||||||||||||||||||||||||||||||||||||||||||||||||||||||||
| Codename | N17E-Q1 Max-Q |
Benchmarks
3DM Vant. Perf. total + NVIDIA Quadro P620
specvp11 snx-01 + NVIDIA Quadro P1000
specvp12 sw-03 + NVIDIA Quadro P620
Cinebench R15 OpenGL 64 Bit + NVIDIA Quadro P620
GFXBench T-Rex HD Offscreen C24Z16 + NVIDIA Quadro P1000
Average Benchmarks NVIDIA Quadro P620 → 0% n=0
Average Benchmarks NVIDIA Quadro P1000 → 0% n=0
* Smaller numbers mean a higher performance
1 This benchmark is not used for the average calculation
Game Benchmarks
The following benchmarks stem from our benchmarks of review laptops. The performance depends on the used graphics memory, clock rate, processor, system settings, drivers, and operating systems. So the results don't have to be representative for all laptops with this GPU. For detailed information on the benchmark results, click on the fps number.

FIFA 20
2019
Borderlands 3
2019
F1 2019
2019
Metro Exodus
2019
Apex Legends
2019
FIFA 19
2018

F1 2018
2018
Far Cry 5
2018
X-Plane 11.11
2018

Fortnite
2018

Call of Duty WWII
2017
Destiny 2
2017
Rocket League
2017Prey
2017For Honor
2017
Battlefield 1
2016
Civilization 6
2016
Overwatch
2016
Doom
2016


Rainbow Six Siege
2015Dota 2 Reborn
2015
The Witcher 3
2015BioShock Infinite
2013
Guild Wars 2
2012Average Gaming NVIDIA Quadro P620 → 100%
Average Gaming 30-70 fps → 100%
Average Gaming NVIDIA Quadro P1000 → 94%
Average Gaming 30-70 fps → 96%
| NVIDIA Quadro P620 | NVIDIA Quadro P1000 | NVIDIA Quadro P3000 Max-Q | |||||||||||||||||||
|---|---|---|---|---|---|---|---|---|---|---|---|---|---|---|---|---|---|---|---|---|---|
| low | med. | high | ultra | QHD | 4K | low | med. | high | ultra | QHD | 4K | low | med. | high | ultra | QHD | 4K | ||||
| FIFA 20 | 166 | 117.8 | 112 | 92.4 | |||||||||||||||||
| Borderlands 3 | 75.8 | 29.7 | 19.3 | 14.5 | |||||||||||||||||
| F1 2019 | 102 | 46 | 39 | 26 | |||||||||||||||||
| Metro Exodus | 46.6 | 21.4 | 15.5 | 12.9 | |||||||||||||||||
| Apex Legends | 88.4 | 35.2 | 29.1 | 26 | |||||||||||||||||
| Shadow of the Tomb Raider | 70 | 16 | 14 | 12 | |||||||||||||||||
| F1 2018 | 106 | 55 | 42 | 25 | 96 | 53 | 41 | 25 | |||||||||||||
| X-Plane 11.11 | 104 | 71.3 | 63.9 | ||||||||||||||||||
| Final Fantasy XV Benchmark | 52 | 26 | 18 | 51.9 | 25.3 | 18.2 | |||||||||||||||
| Fortnite | 183.6 | 113.2 | 41.9 | 29.3 | |||||||||||||||||
| Destiny 2 | 100.5 | 48.6 | 37.6 | 30.1 | |||||||||||||||||
| Middle-earth: Shadow of War | 96 | 37 | 27 | 20 | |||||||||||||||||
| Rocket League | 248.9 | 153.5 | 96.5 | 235.5 | 123.8 | 81.8 | |||||||||||||||
| Prey | 144.7 | 74.8 | 56.7 | ||||||||||||||||||
| Overwatch | 261.8 | 169 | 77 | ||||||||||||||||||
| Doom | 96.7 | 76.3 | 44.1 | 91.7 | 78.4 | 43.3 | 41.6 | ||||||||||||||
| Ashes of the Singularity | 50.6 | 29.2 | 25.4 | ||||||||||||||||||
| Rise of the Tomb Raider | 101.9 | 62.9 | 33.7 | 26.4 | 97 | 57 | 31 | 26 | 10.6 | ||||||||||||
| Dota 2 Reborn | 156 | 139 | 90.2 | 82.8 | |||||||||||||||||
| The Witcher 3 | 96 | 55 | 32 | 17 | 89 | 54 | 29 | 16 | |||||||||||||
| BioShock Infinite | 301.7 | 160.9 | 140 | 52.8 | 252 | 152 | 133 | 51 | |||||||||||||
| StarCraft II: Heart of the Swarm | 542 | 258.9 | 156.8 | 82.4 | |||||||||||||||||
| Guild Wars 2 | 149.9 | 73.1 | 28.4 | ||||||||||||||||||
| NVIDIA Quadro P620 | NVIDIA Quadro P1000 | NVIDIA Quadro P3000 Max-Q | |||||||||||||||||||
| low | med. | high | ultra | QHD | 4K | low | med. | high | ultra | QHD | 4K | low | med. | high | ultra | QHD | 4K | < 30 fps < 60 fps < 120 fps ≥ 120 fps | 3 11 9 | 5 6 6 5 | 7 8 6 2 | 11 2 3 | | | < 30 fps < 60 fps < 120 fps ≥ 120 fps | 1 4 2 | 1 3 1 2 | 2 3 1 1 | 3 2 | | 1 | < 30 fps < 60 fps < 120 fps ≥ 120 fps | | | | | | |
For more games that might be playable and a list of all games and graphics cards visit our Gaming List