

NVIDIA GeForce RTX 4080 Super vs NVIDIA GeForce RTX 4070 Ti SUPER
NVIDIA GeForce RTX 4080 Super
► remove from comparison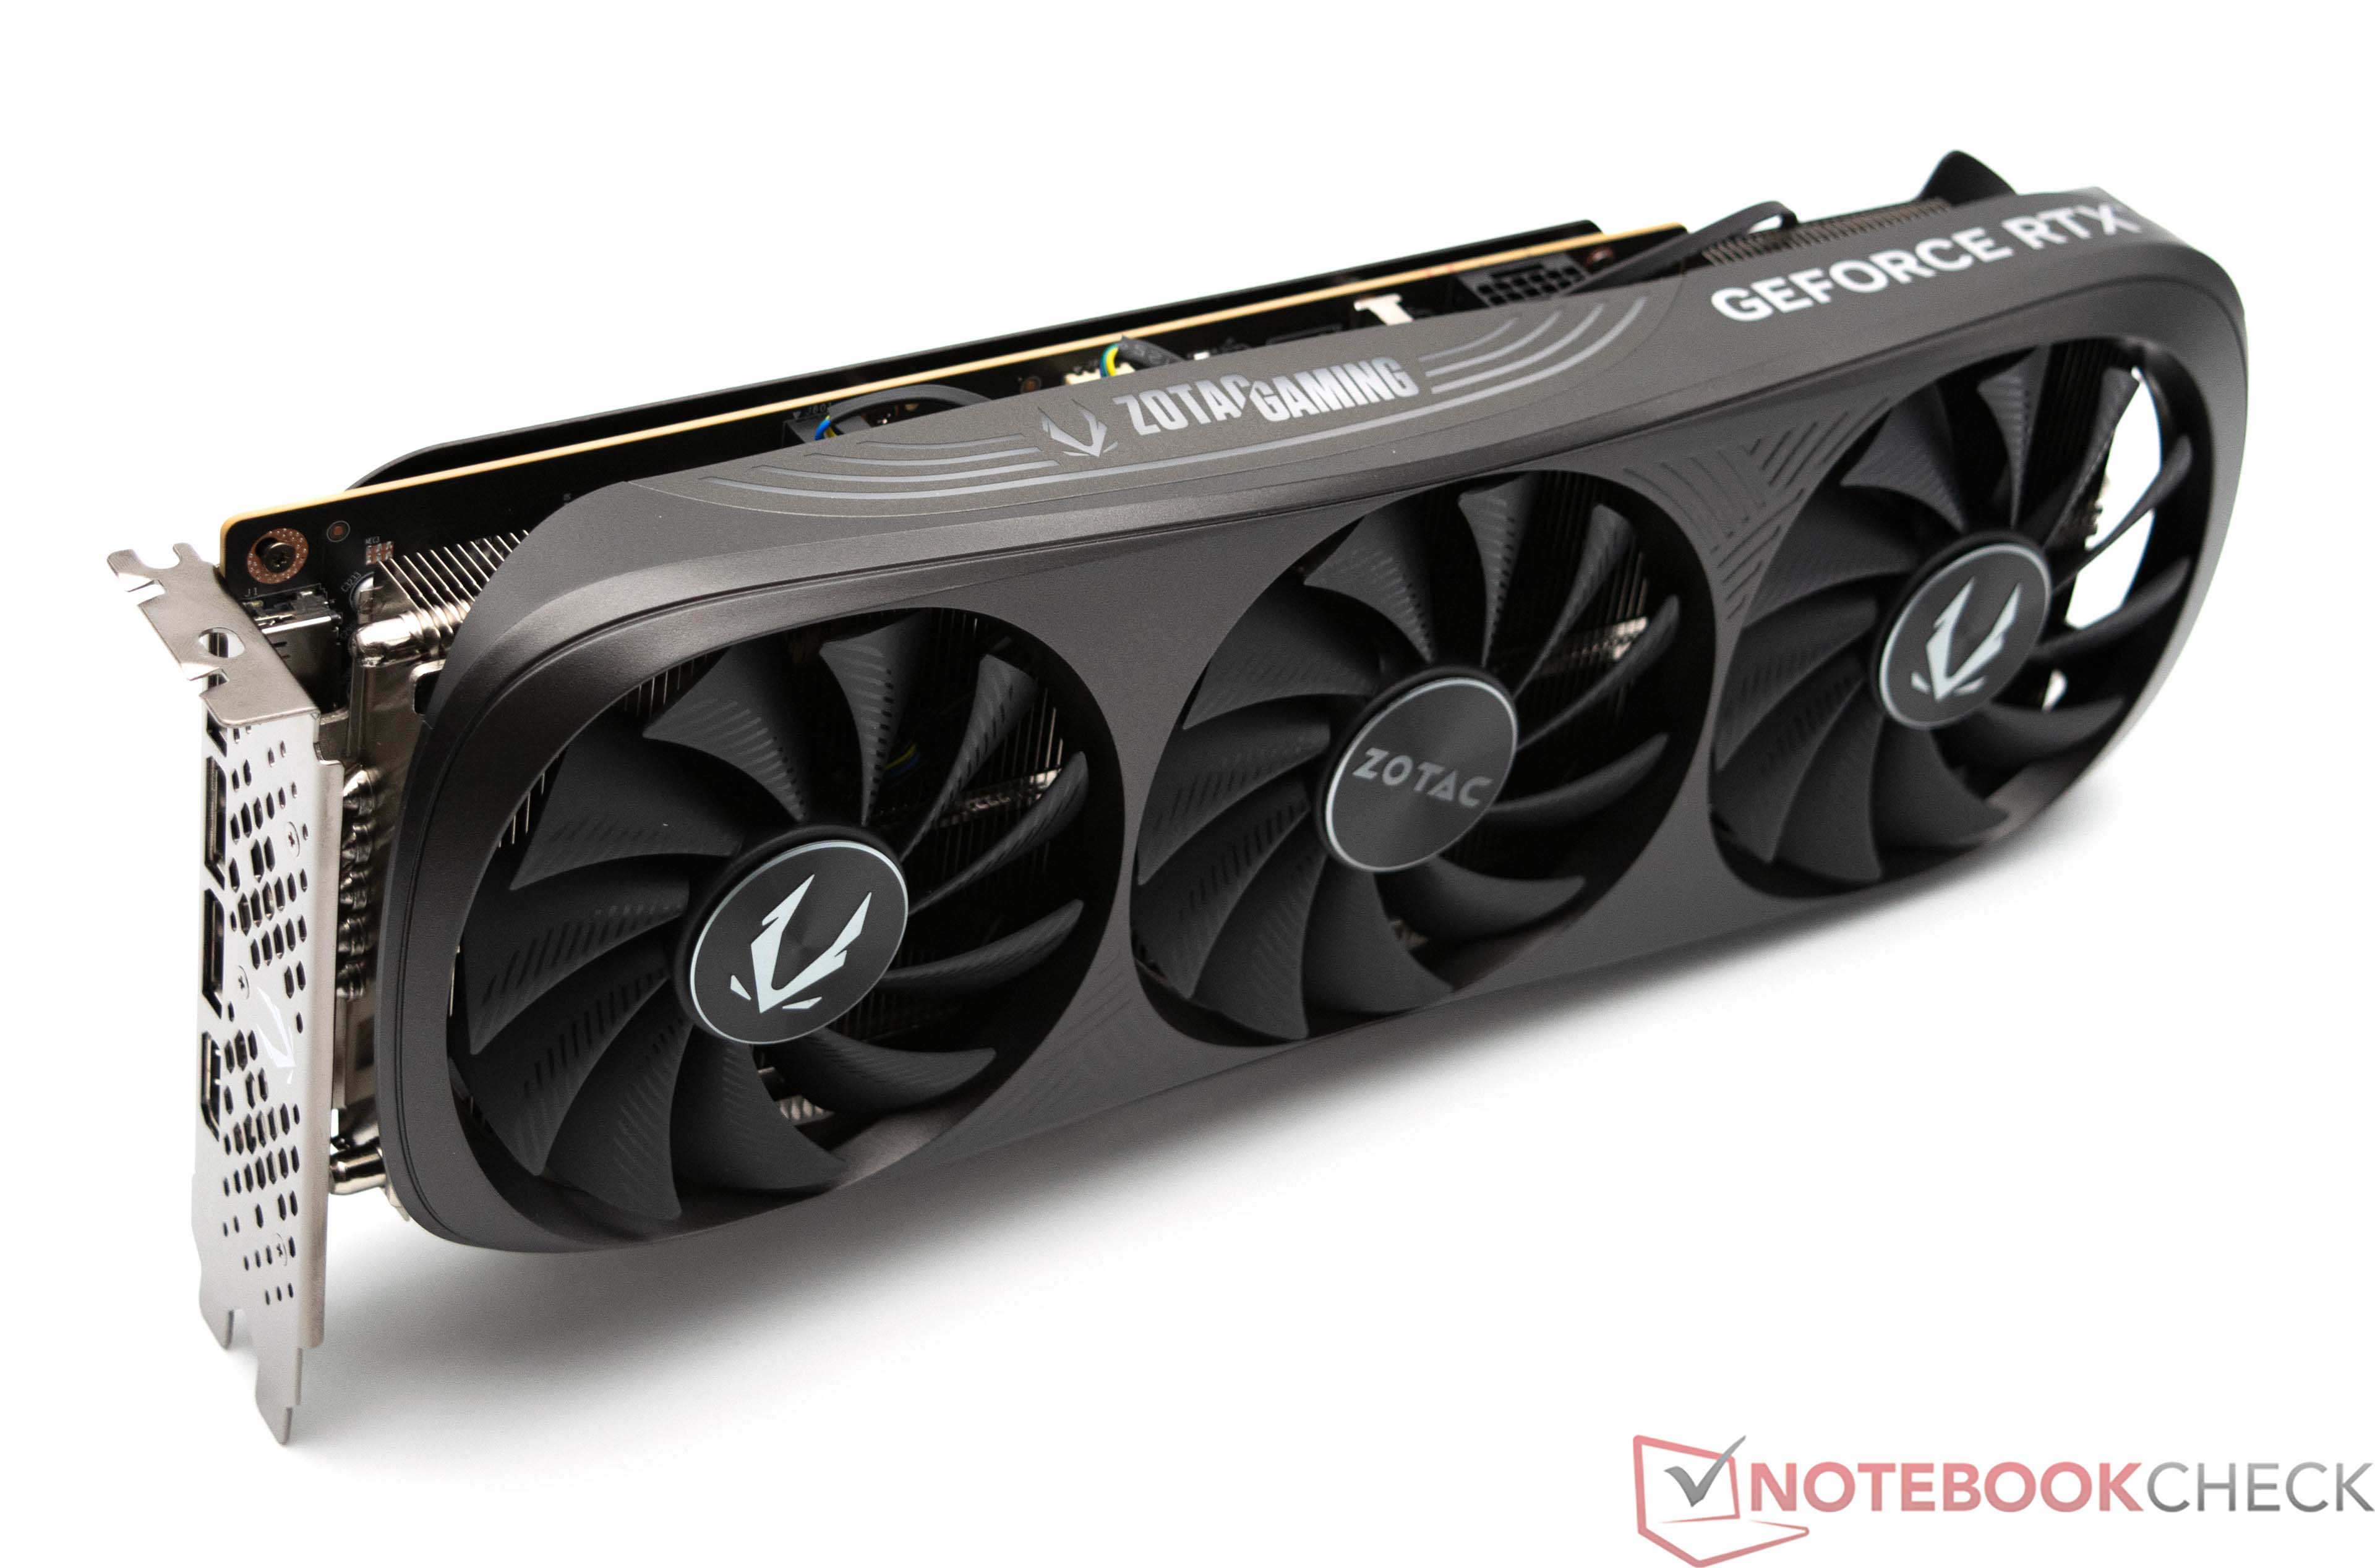
The Nvidia GeForce RTX 4080 Super is a high-end desktop graphics card based on the Ada Lovelace architecture. It uses the AD103 chip in full configuration with 10,240 cores and 16 GB GDDR6X graphics memory (256-bit bus with 23 Gbits).
Performance
The ray tracing performance is outstanding, thanks to 80 dedicated cores, and the 320 Tensor cores can be used for DLSS 3.
The gaming performance without DLSS is ideal for 4k with around 60fps and 2k with higher frame rates in demanding games without ray tracing effects (e.g. F1 22 or Cyberpunk 2077). With ray tracing, the use of DLSS is recommended. Compared to the competition, the performance without DLSS and ray tracing is slightly better than the significantly cheaper AMD Radeon RX 7900 XT.
The currently available RTX 4080 cards are very large (2.5 or 3 slots) and use the new 12VHPWR connector (which has caused some problems with adapters).
Power consumption
The AD103 chip is produced at TSMC in 5nm (4N with EUV) and is specified with a TGP (Total Graphics Power) of 320 watts (Nvidia recommends at least a 750-watt power supply).
NVIDIA GeForce RTX 4070 Ti SUPER
► remove from comparison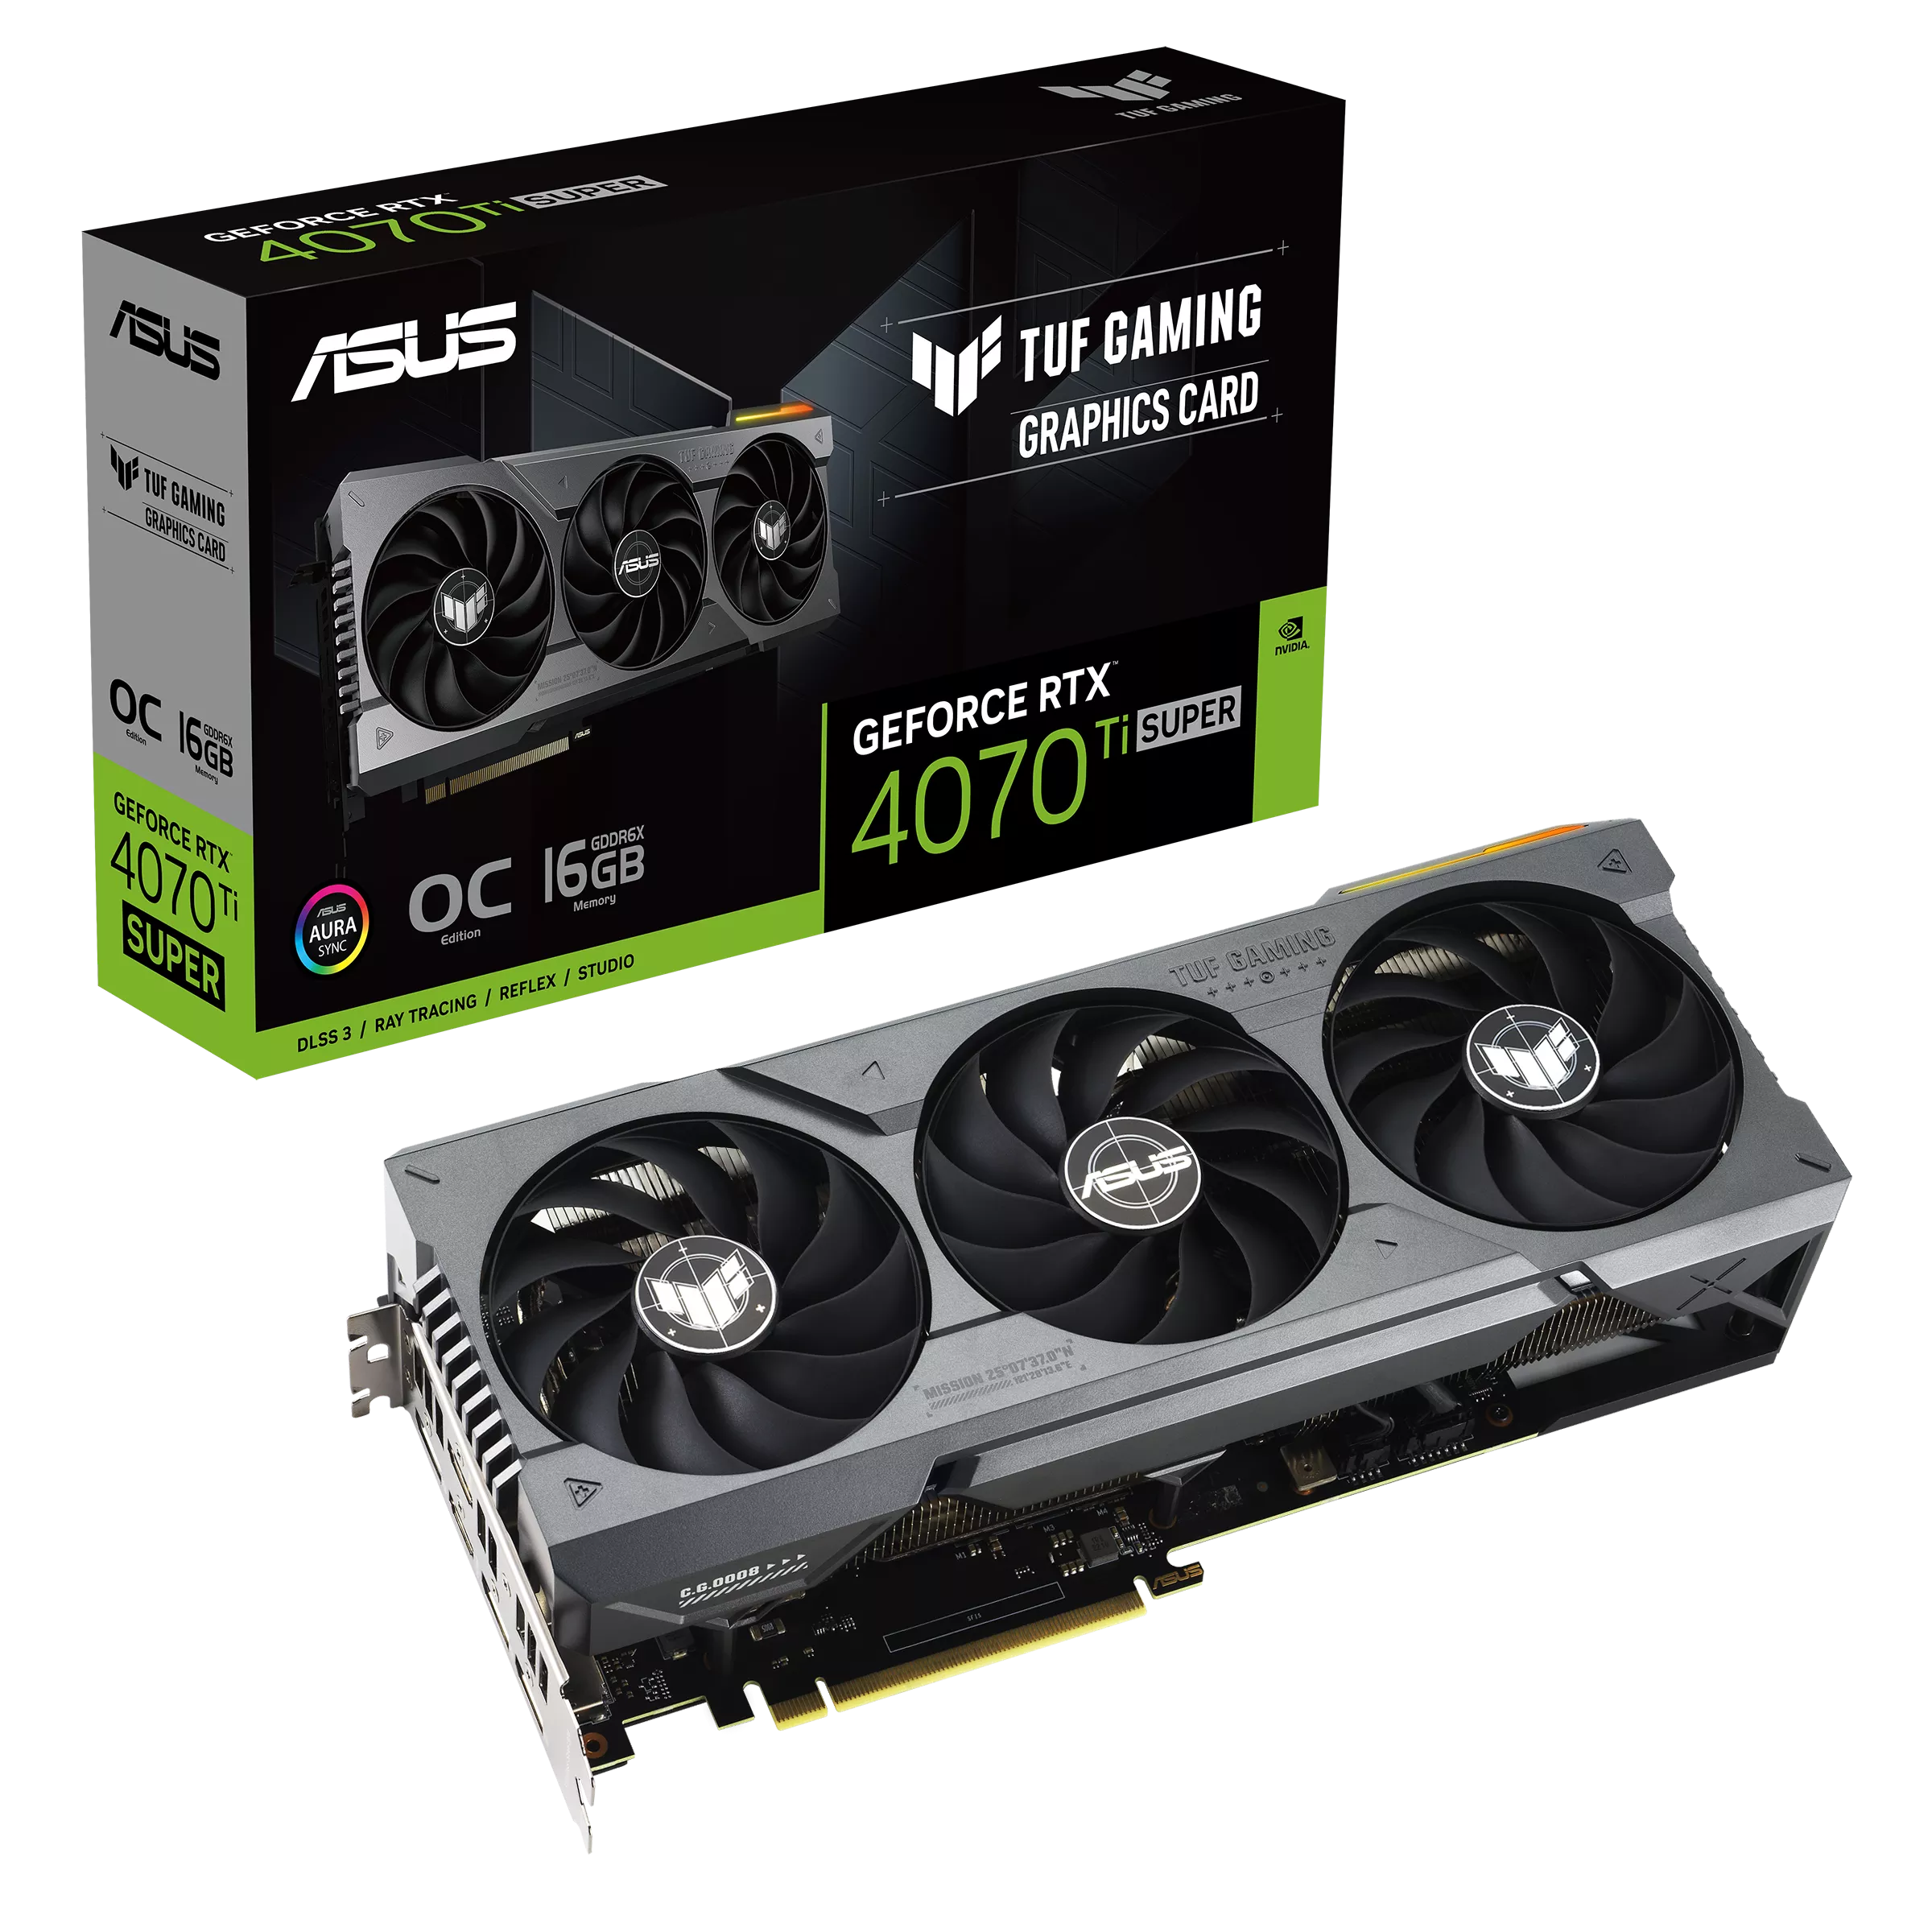
The Nvidia GeForce RTX 4070 Ti SUPER is a high-end desktop graphics card based on the Ada Lovelace architecture. It uses the AD103 chip and offers 8.448 cores and 16 GB GDDR6X graphics memory (256-bit bus with 22.4 Gbits).
Performance
The gaming performance is still sufficient for 4k with ultra settings, even in demanding games such as Cyberpunk, but 60 fps is no longer always achieved. With ray tracing, the use of DLSS and possibly reducing the resolution is recommended. In a competitive comparison, the SUPER variant ranks, as expected, between the RTX 4080 and the old 4070 Ti in a competitive comparison.
Power consumption
The AD103 chip is produced at TSMC in 5nm (4N with EUV) and is specified with a TGP (Total Graphics Power) of 285 watts.
| NVIDIA GeForce RTX 4080 Super | NVIDIA GeForce RTX 4070 Ti SUPER | |||||||||||||||||||||||||||||||||||||||||||||||||||||||||||||
| GeForce RTX 4000 Series |
|
| ||||||||||||||||||||||||||||||||||||||||||||||||||||||||||||
| Codename | AD103-400-A1 | AD103-275 | ||||||||||||||||||||||||||||||||||||||||||||||||||||||||||||
| Architecture | Ada Lovelace | Ada Lovelace | ||||||||||||||||||||||||||||||||||||||||||||||||||||||||||||
| Pipelines | 10240 - unified | 8448 - unified | ||||||||||||||||||||||||||||||||||||||||||||||||||||||||||||
| TMUs | 320 | 264 | ||||||||||||||||||||||||||||||||||||||||||||||||||||||||||||
| ROPs | 112 | 96 | ||||||||||||||||||||||||||||||||||||||||||||||||||||||||||||
| Raytracing Cores | 80 | 66 | ||||||||||||||||||||||||||||||||||||||||||||||||||||||||||||
| Tensor / AI Cores | 320 | 264 | ||||||||||||||||||||||||||||||||||||||||||||||||||||||||||||
| Core Speed | 2295 - 2550 (Boost) MHz | 2340 - 2610 (Boost) MHz | ||||||||||||||||||||||||||||||||||||||||||||||||||||||||||||
| Theoretical Performance | 52.22 TFLOPS FP16, 52.22 TFLOPS FP32, 816 TFLOPS FP64 | 40.1 TFLOPS FP16, 40.1 TFLOPS FP32, 0.63 TFLOPS FP64 | ||||||||||||||||||||||||||||||||||||||||||||||||||||||||||||
| Cache | L2: 64 MB | L2: 48 MB | ||||||||||||||||||||||||||||||||||||||||||||||||||||||||||||
| Memory Speed | 23000 effective = 1438 MHz | 21000 effective = 1400 MHz | ||||||||||||||||||||||||||||||||||||||||||||||||||||||||||||
| Memory Bus Width | 256 Bit | 256 Bit | ||||||||||||||||||||||||||||||||||||||||||||||||||||||||||||
| Memory Type | GDDR6X | GDDR6X | ||||||||||||||||||||||||||||||||||||||||||||||||||||||||||||
| Max. Amount of Memory | 16 GB | 16 GB | ||||||||||||||||||||||||||||||||||||||||||||||||||||||||||||
| Shared Memory | no | no | ||||||||||||||||||||||||||||||||||||||||||||||||||||||||||||
| Memory Bandwidth | 736.3 GB/s | |||||||||||||||||||||||||||||||||||||||||||||||||||||||||||||
| API | DirectX 12 Ultimate (12_2), Shader 6.7, OpenGL 4.6, OpenCL 3.0, Vulkan 1.3 | DirectX 12 Ultimate, Shader 6.7, OpenGL 4.6, OpenCL 3.0, Vulkan 1.3 | ||||||||||||||||||||||||||||||||||||||||||||||||||||||||||||
| Power Consumption | 320 Watt | 285 Watt | ||||||||||||||||||||||||||||||||||||||||||||||||||||||||||||
| Transistors | 45.900 Million | 45.9 Billion | ||||||||||||||||||||||||||||||||||||||||||||||||||||||||||||
| Die Size | 379 mm² | 379 mm² | ||||||||||||||||||||||||||||||||||||||||||||||||||||||||||||
| technology | 5 nm | 5 nm | ||||||||||||||||||||||||||||||||||||||||||||||||||||||||||||
| PCIe | PCIe 4.0 x16 | 4.0 x16 | ||||||||||||||||||||||||||||||||||||||||||||||||||||||||||||
| Displays | 4 Displays (max.), HDMI 2.1, DisplayPort 1.4a | 4 Displays (max.), HDMI 2.1, DisplayPort 1.4a | ||||||||||||||||||||||||||||||||||||||||||||||||||||||||||||
| Date of Announcement | 31.01.2024 | 24.01.2024 | ||||||||||||||||||||||||||||||||||||||||||||||||||||||||||||
| Predecessor | NVIDIA GeForce RTX 4070 Ti |
Benchmarks
3DM Vant. Perf. total + NVIDIA GeForce RTX 4080 Super
specvp12 sw-03 + NVIDIA GeForce RTX 4080 Super
Cinebench R15 OpenGL 64 Bit + NVIDIA GeForce RTX 4070 Ti SUPER
Average Benchmarks NVIDIA GeForce RTX 4080 Super → 100% n=19
Average Benchmarks NVIDIA GeForce RTX 4070 Ti SUPER → 113% n=19
* Smaller numbers mean a higher performance
1 This benchmark is not used for the average calculation
Game Benchmarks
The following benchmarks stem from our benchmarks of review laptops. The performance depends on the used graphics memory, clock rate, processor, system settings, drivers, and operating systems. So the results don't have to be representative for all laptops with this GPU. For detailed information on the benchmark results, click on the fps number.

Black Myth: Wukong
2024
Skull & Bones
2024
Helldivers 2
2024
Enshrouded
2024
Palworld
2024

Ready or Not
2023
The Finals
2023


EA Sports WRC
2023
Alan Wake 2
2023
Lords of the Fallen
2023
Total War Pharaoh
2023

Counter-Strike 2
2023

Baldur's Gate 3
2023
Lies of P
2023
Starfield
2023
Armored Core 6
2023
Immortals of Aveum
2023
Atlas Fallen
2023

F1 23
2023
Diablo 4
2023

Dead Island 2
2023
The Last of Us
2023

Company of Heroes 3
2023
Sons of the Forest
2023
Atomic Heart
2023
Returnal
2023
Hogwarts Legacy
2023
Dead Space Remake
2023
The Witcher 3 v4
2023
High On Life
2023


The Quarry
2022
F1 22
2022
Ghostwire Tokyo
2022

Cyberpunk 2077 1.6
2022
GRID Legends
2022
Dying Light 2
2022
God of War
2022
Forza Horizon 5
2021

Far Cry 6
2021
F1 2021
2021

Dirt 5
2020
Watch Dogs Legion
2020

Horizon Zero Dawn
2020
Death Stranding
2020
F1 2020
2020
Borderlands 3
2019
Control
2019
Anno 1800
2019
Far Cry New Dawn
2019
Metro Exodus
2019

Forza Horizon 4
2018

Strange Brigade
2018
Far Cry 5
2018
X-Plane 11.11
2018

Dota 2 Reborn
2015
The Witcher 3
2015
GTA V
2015Average Gaming NVIDIA GeForce RTX 4080 Super → 100%
Average Gaming 30-70 fps → 100%
Average Gaming NVIDIA GeForce RTX 4070 Ti SUPER → 85%
Average Gaming 30-70 fps → 83%
| NVIDIA GeForce RTX 4080 Super | NVIDIA GeForce RTX 4070 Ti SUPER | |||||||||||||
|---|---|---|---|---|---|---|---|---|---|---|---|---|---|---|
| low | med. | high | ultra | QHD | 4K | low | med. | high | ultra | QHD | 4K | |||
| Black Myth: Wukong | 26 | |||||||||||||
| Avatar Frontiers of Pandora | 213 | 196 | 167 | 134 | 92 | 49 | 163 | 141.8 | 113.2 | 76.6 | 39.8 | |||
| Call of Duty Modern Warfare 3 2023 | 367 | 325 | 269 | 252 | 195 | 133 | 227 | 184 | 179 | 133 | 84 | |||
| Alan Wake 2 | 165 | 150 | 140 | 101 | 57 | 124.7 | 114.4 | 82.5 | 44.7 | |||||
| Assassin's Creed Mirage | 279 | 259 | 245 | 198 | 162 | 102 | 221 | 206 | 170 | 136 | 84 | |||
| Cyberpunk 2077 2.2 Phantom Liberty | 231 | 227 | 205 | 185 | 125 | 58 | 188.5 | 188.5 | 170.8 | 150.3 | 94.9 | 43 | ||
| Baldur's Gate 3 | 276 | 254 | 243 | 239 | 187 | 101 | 246 | 223 | 218 | 157.8 | 117.2 | |||
| F1 23 | 462 | 495 | 428 | 169 | 110 | 55 | 385 | 402 | 363 | 138.2 | 90 | 45.1 | ||
| The Callisto Protocol | 292 | 270 | 261 | 207 | 168 | 111 | 210.62 | 202.94 | 149.39 | 114.82 | 70.04 | |||
| F1 22 | 456 | 461 | 396 | 173 | 117 | 60 | 371 | 384 | 336 | 144.9 | 95.1 | 48.9 | ||
| Ghostwire Tokyo | 318 | 313 | 307 | 303 | 267 | 126 | 278 | 282 | 283 | 217 | 99.2 | |||
| Cyberpunk 2077 1.6 | 236 | 233 | 225 | 202 | 128 | 62 | 196.9 | 195.9 | 172.3 | 157.5 | 103.6 | 49.7 | ||
| Dying Light 2 | 217 | 165.9 | 123.7 | 65 | 213 | 162.2 | 121.5 | 63.7 | ||||||
| Far Cry 6 | 258 | 225 | 202 | 182 | 178 | 109 | 209 | 191 | 169 | 154 | 91 | |||
| Watch Dogs Legion | 149 | 144.5 | 127 | 80.5 | 171.2 | 159.3 | 144.2 | 115.9 | 68.6 | |||||
| Mafia Definitive Edition | 248 | 232 | 202 | 111.4 | 239 | 231 | 181 | 96.6 | ||||||
| Borderlands 3 | 260 | 230 | 203 | 194 | 168 | 98 | 192.1 | 176.8 | 169.6 | 143.6 | 79.4 | |||
| Control | 238 | 232 | 226 | 160 | 82 | 226 | 196.9 | 130.3 | 66.4 | |||||
| Metro Exodus | 278 | 272 | 219 | 182 | 157 | 103 | 236 | 193.5 | 158.3 | 130.9 | 84.4 | |||
| Shadow of the Tomb Raider | 328 | 311 | 297 | 287 | 242 | 133 | 273 | 269 | 256 | 205 | 109.5 | |||
| Strange Brigade | 716 | 583 | 546 | 512 | 396 | 200 | 568 | 467 | 442 | 407 | 306 | 161.9 | ||
| Far Cry 5 | 274 | 240 | 222 | 216 | 206 | 142 | 203 | 197 | 188 | 187 | 119 | |||
| X-Plane 11.11 | 246 | 215 | 161 | 137 | 224 | 196.7 | 150 | 127.8 | ||||||
| Final Fantasy XV Benchmark | 235 | 234 | 228 | 200 | 120 | 235 | 235 | 209 | 168.8 | 98.9 | ||||
| Dota 2 Reborn | 289 | 261 | 251 | 233 | 227 | 245 | 228 | 226 | 202 | 203 | ||||
| The Witcher 3 | 791 | 731 | 522 | 258 | 213 | 199 | 558 | 430 | 210 | 159.3 | ||||
| GTA V | 188 | 188 | 187 | 170 | 168 | 179 | 187.6 | 187.6 | 187.4 | 160.1 | 155.3 | 182.1 | ||
| NVIDIA GeForce RTX 4080 Super | NVIDIA GeForce RTX 4070 Ti SUPER | |||||||||||||
| low | med. | high | ultra | QHD | 4K | low | med. | high | ultra | QHD | 4K | < 30 fps < 60 fps < 120 fps ≥ 120 fps | 23 | 25 | 26 | 20 | 4 20 | 4 12 10 | < 30 fps < 60 fps < 120 fps ≥ 120 fps | 9 | 26 | 1 25 | 1 19 | 8 16 | 1 6 15 4 |
For more games that might be playable and a list of all games and graphics cards visit our Gaming List