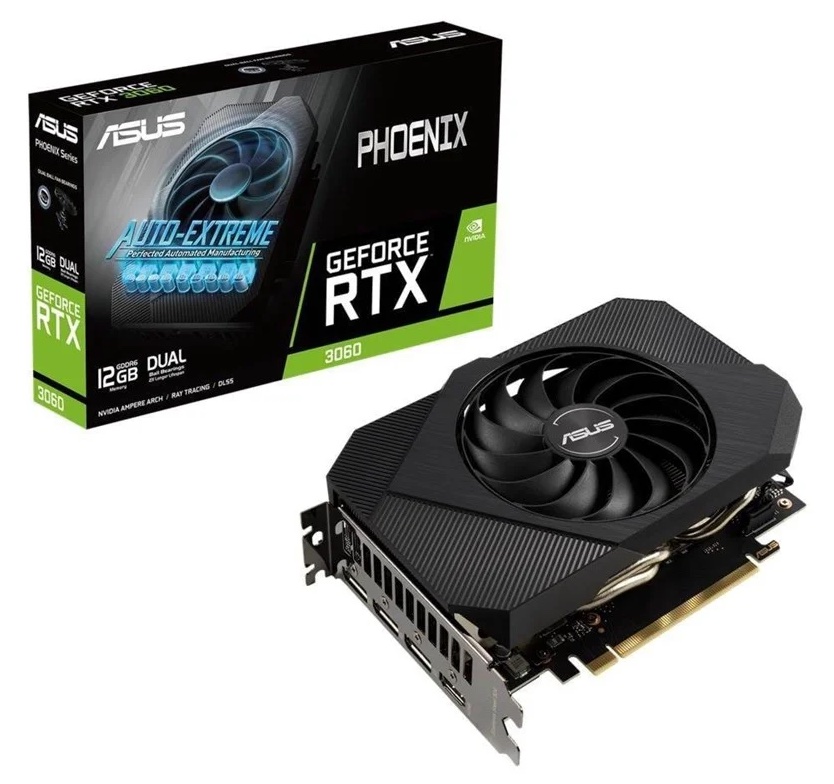
NVIDIA GeForce RTX 3060 ► remove from comparison Die Nvidia GeForce RTX 3060 ist eine High-End Desktop Grafikkarte mit 12 GB Videospeicher. Im Januar wurde diese Grafikkarte präsentiert, wenngleich die Verfügbarkeit nur bedingt befriedigt werden konnte. Die GeForce RTX 3060 ist die kleinste Version der neuen RTX 3000 Serie, die nun mit der Ampere-Architektur Turing komplett abgelöst hat. Die GPU verfügt über 3.584 Shadereinheiten / Kerne und basiert auf dem GA106-Chip. Der VRAM fällt mit 12-GB-GDDR6-Speicher üppig aus.
Features
Der GA106-Chip wird in 8nm gefertigt und bietet weiterhin die bekannten Features, wie DLSS (Deep Learning Super Sampling) und Real Time Ray Tracing. Allerdings hat Nvidia hier stark nachgebessert um die Leistung bei Nutzung dieser Features nochmals deutlich zu steigern.
Performance
Die Performance der GeForce RTX 3060 liegt etwas über dem Niveau einer Nvidia GeForce RTX 2070. Damit ordnet sich die RTX 3060 im unteren High-End-Segment ein und kann alle modernen Spiele der Jahre 2020 und 2021 in hohen Einstellungen und in 1.080p flüssig darstellen.
Leistungsaufnahme
Die Leistungsaufnahme der GeForce RTX 3060 wird vom Hersteller mit 170 Watt beziffert und liegt damit etwas über dem Vorgängermodell (GeForce RTX 2060 160 Watt). Im Vergleich zur ähnlich schnellen Nvidia GeForce RTX 2070, ist der Stromverbrauch jedoch etwas geringer. Die Leistung pro Watt konnte somit nochmals gesteigert werden.
NVIDIA GeForce RTX 3050 6GB Laptop GPU ► remove from comparison Die Nvidia GeForce RTX 3050 6 GB Laptop GPU (oder Mobile, NVIDIA_DEV.2583, GN20-P0-R 6GB, 3050 Refresh) ist der Refresh der RTX 3050 mit 4GB und bietet neben dem größeren Grafikspeicher auch mehr Shader (2.560 Kerne = +25% wie die RTX 3050 Ti ). Dafür wurde der Speicherbus von 128 Bit auf 96 Bit reduziert.
Wie üblich wird es verschiedene Varianten mit einem TGP von 35 - 50 (ehemals Max-Q) und 60 - 80 Watt geben. Diese takten von 713 - 1530 (Basistakt) bis 1058 - 1740 (Boost) und bieten dementsprechend eine unterschiedliche Performance.
Die durchschnittliche Leistung sollte etwas oberhalb der alten RTX 3050 (4GB) Laptop GPU liegen und knapp hinter der RTX 3050 Ti .
Der GA107 Chip bietet 3.072 FP32 ALUs wovon die Hälfte auch INT32 Befehle ausführen können (also 1.536 INT32 ALUs). Bei Turing konnten noch alle Shader FP32 oder INT32 ausführen. Die Raytracing und Tensor Kerne auf dem Chip wurden laut Nvidia ebenfalls verbessert. Weiters integriert der Ampere Chip einen Hardware Video-Encoder (NVENC 5. Generation für H.264 und H.265) und Decoder (7. Generation für zahlreiche Formate inklusive AV1).
Der GA107 Chip wird bei Samsung im 8nm (8N) Verfahren welches mit dem 7nm Verfahren von TSMC nicht ganz mithalten kann (z.B. von AMD genutzt, aber auch für den professionellen GA100 Ampere Chip).
NVIDIA GeForce RTX 3060 NVIDIA GeForce RTX 3050 6GB Laptop GPU GeForce RTX 3000 Serie Codename Ampere GA106 GN20-P0-R 6GB Architektur Ampere Ampere Pipelines 3584 - unified 2560 - unified TMUs 112 80 ROPs 48 32 Raytracing Cores 28 16 Tensor / AI Cores 112 64 Kerntakt 1320 - 1777 (Boost) MHz 1237 - 1492 (Boost) MHz Speichertakt 15000 effective = 1875 MHz 12000 effective = 1500 MHz Speicherbandbreite 192 Bit 96 Bit Speichertyp GDDR6 GDDR6 Max. Speichergröße 12 GB 6 GB Shared Memory nein nein Memory Bandwidth 360 GB/s 144 GB/s API DirectX 12_2, Shader 6.6, OpenGL 4.6 DirectX 12_2, Shader 6.7, OpenGL 4.6 Stromverbrauch 170 Watt 60 Watt (35 - 80 Watt TGP) Transistors 12 Billion Die Size 13250 mm² Herstellungsprozess 8 nm 8 nm PCIe 4.0 4.0 Displays HDMI 2.1, DisplayPort 1.4a HDMI 2.1, DisplayPort 1.4a Features NVIDIA DLSS, NVIDIA Reflex, Resizable BAR, NVIDIA Broadcast, NVIDIA Ansel, NVIDIA ShadowPlay®, NVIDIA G-SYNC®, VR-ready, Nvidia Omniverse NVIDIA DLSS, NVIDIA Reflex, Resizable BAR, NVIDIA Broadcast, NVIDIA Ansel, NVIDIA ShadowPlay, NVIDIA G-SYNC, Advanced Optimus, Nvidia Max-Q, Dynamic Boost Erscheinungsdatum 12.01.2021 06.01.2023 Herstellerseite www.nvidia.com Notebookgröße groß (17" z.B.) Predecessor GeForce RTX 3050 4GB Laptop GPU
Performance Rating - 3DMark 11 + Fire Strike + Time Spy - NVIDIA GeForce RTX 3060
Performance Rating - 3DMark 11 + Fire Strike + Time Spy - GeForce RTX 3050 6GB Laptop GPU
...
NVIDIA GeForce RTX 3050 6GB Laptop GPU
...
3DMark - 3DMark Speed Way Score
min: 2216 avg: 2221 median: 2220.5 (15%) max: 2225 Points
min: 1058 avg: 1059 median: 1058.5 (7%) max: 1059 Points
GPU TDP 63 W TDP 65 W TDP 170 W 48% 48% 100%
3DMark - 3DMark Steel Nomad
min: 1989 avg: 2038 median: 1995 (14%) max: 2131 Points
3DMark - 3DMark Wild Life Extreme Unlimited
3DMark - 3DMark Solar Bay
3DMark - 3DMark Fire Strike Standard Score
min: 15750 avg: 19730 median: 20911 (32%) max: 21586 Points
GPU TDP ? TDP 170 W 100% 93%
min: 10765 avg: 10944 median: 10840 (16%) max: 11330 Points
GPU TDP ? TDP 50 W TDP 60 W TDP 63 W TDP 65 W TDP 170 W 100% 53% 53% 55% 53% 93%
3DMark - 3DMark Fire Strike Standard Graphics
min: 18711 avg: 21264 median: 21689 (20%) max: 22327 Points
GPU TDP ? TDP 170 W 100% 97%
min: 11887 avg: 12113 median: 11973 (11%) max: 12618 Points
GPU TDP ? TDP 50 W TDP 60 W TDP 63 W TDP 65 W TDP 170 W 100% 55% 55% 58% 56% 97%
3DMark - 3DMark Ice Storm Graphics
min: 326331 avg: 427886 median: 438544 (49%) max: 490039 Points
GPU TDP ? TDP 170 W 100% 95%
GPU TDP ? TDP 60 W TDP 170 W 100% 18% 95%
3DMark - 3DMark Time Spy Score
min: 7303 avg: 8886 median: 9026 (24%) max: 9782 Points
GPU TDP ? TDP 170 W 100% 98%
min: 4933 avg: 5049 median: 5033 (13%) max: 5182 Points
GPU TDP ? TDP 50 W TDP 63 W TDP 65 W TDP 170 W 100% 55% 58% 56% 98%
3DMark - 3DMark Time Spy Graphics
min: 7866 avg: 8558 median: 8578 (17%) max: 8897 Points
GPU TDP ? TDP 170 W 100% 100%
min: 4501 avg: 4631 median: 4571 (9%) max: 4820 Points
GPU TDP ? TDP 50 W TDP 63 W TDP 65 W TDP 170 W 100% 52% 56% 53% 100%
3DMark - 3DMark Ice Storm Unlimited Graphics
min: 478217 avg: 612349 median: 561364 (57%) max: 806680 Points
GPU TDP ? TDP 170 W 83% 100%
GPU TDP ? TDP 60 W TDP 170 W 83% 77% 100%
3DMark - 3DMark Ice Storm Extreme Graphics
min: 289413 avg: 358304 median: 356550 (42%) max: 419899 Points
GPU TDP ? TDP 170 W 100% 97%
GPU TDP ? TDP 60 W TDP 170 W 100% 22% 97%
3DMark - 3DMark Cloud Gate Score
min: 31438 avg: 56666 median: 56566 (53%) max: 72456 Points
GPU TDP ? TDP 170 W 100% 98%
GPU TDP ? TDP 60 W TDP 170 W 100% 75% 98%
3DMark - 3DMark Cloud Gate Graphics
min: 96330 avg: 118306 median: 120756 (30%) max: 124830 Points
GPU TDP ? TDP 170 W 100% 98%
GPU TDP ? TDP 60 W TDP 170 W 100% 60% 98%
3DMark - 3DMark Night Raid
min: 52521 avg: 62142 median: 65191 (62%) max: 68715 Points
3DMark - 3DMark Night Raid Graphics Score
min: 96914 avg: 102366 median: 104641 (40%) max: 105543 Points
3DMark 11 - 3DM11 Performance Score
min: 18861 avg: 26026 median: 26986 (33%) max: 30325 Points
GPU TDP ? TDP 170 W 100% 100%
min: 15844 avg: 16748 median: 16933.5 (20%) max: 17282 Points
GPU TDP ? TDP 50 W TDP 60 W TDP 63 W TDP 65 W TDP 170 W 100% 61% 66% 66% 64% 100%
3DMark 11 - 3DM11 Performance GPU
min: 24369 avg: 28359 median: 28939 (22%) max: 29959 Points
GPU TDP ? TDP 170 W 100% 99%
min: 15860 avg: 16970 median: 16979.5 (13%) max: 18059 Points
GPU TDP ? TDP 50 W TDP 60 W TDP 63 W TDP 65 W TDP 170 W 100% 56% 61% 63% 58% 99%
3DMark Vantage + NVIDIA GeForce RTX 3060 3DMark Vantage - 3DM Vant. Perf. total
min: 75053 avg: 83745 median: 81033 (23%) max: 100659 Points
GPU TDP ? TDP 170 W 89% 100%
3DM Vant. Perf. GPU no PhysX + NVIDIA GeForce RTX 3060 3DMark Vantage - 3DM Vant. Perf. GPU no PhysX
min: 77510 avg: 85087 median: 83168 (45%) max: 98243 Points
GPU TDP ? TDP 170 W 90% 100%
3DMark 05 - 3DMark 05 - Standard
min: 48871 avg: 65489 median: 62529 (68%) max: 84989 Points
GPU TDP ? TDP 170 W 96% 100%
3DMark 06 3DMark 06 - Standard 1280x1024 + NVIDIA GeForce RTX 3060 3DMark 06
min: 47148 avg: 54815 median: 51633 (67%) max: 66584 Points
GPU TDP ? TDP 170 W 88% 100%
Unigine Valley 1.0 - Unigine Valley 1.0 DX
min: 105.1 avg: 106.9 median: 106.7 (32%) max: 108.3 fps
GPU TDP ? TDP 170 W 100% 100%
Blender - Blender 3.3 Classroom CUDA *
min: 107 avg: 111 median: 111 (16%) max: 115 Seconds
GPU TDP 50 W TDP 60 W TDP 63 W TDP 65 W TDP 170 W 100% 101% 101% 101% 110%
Blender - Blender 3.3 Classroom OPTIX *
min: 68 avg: 70 median: 70 (26%) max: 72 Seconds
GPU TDP 50 W TDP 60 W TDP 63 W TDP 65 W TDP 170 W 100% 102% 102% 100% 120%
SPECviewperf 12 + NVIDIA GeForce RTX 3060 SPECviewperf 12 - specvp12 sw-03
min: 47.8 avg: 65.3 median: 69.3 (17%) max: 75.9 fps
GPU TDP ? TDP 170 W 100% 99%
specvp12 snx-02 + NVIDIA GeForce RTX 3060 SPECviewperf 12 - specvp12 snx-02
min: 7.39 avg: 9 median: 8.9 (1%) max: 10.4 fps
GPU TDP ? TDP 170 W 100% 97%
specvp12 showcase-01 + NVIDIA GeForce RTX 3060 SPECviewperf 12 - specvp12 showcase-01
min: 72.6 avg: 108.4 median: 114.5 (20%) max: 119 fps
GPU TDP ? TDP 170 W 100% 88%
specvp12 mediacal-01 + NVIDIA GeForce RTX 3060 SPECviewperf 12 - specvp12 mediacal-01
min: 24.9 avg: 44.6 median: 43 (11%) max: 71.2 fps
GPU TDP ? TDP 170 W 95% 100%
specvp12 maya-04 + NVIDIA GeForce RTX 3060 SPECviewperf 12 - specvp12 maya-04
min: 66 avg: 167.5 median: 183 (50%) max: 204 fps
GPU TDP ? TDP 170 W 100% 85%
specvp12 energy-01 + NVIDIA GeForce RTX 3060 SPECviewperf 12 - specvp12 energy-01
min: 8.21 avg: 9.9 median: 10.1 (9%) max: 10.7 fps
GPU TDP ? TDP 170 W 100% 94%
specvp12 creo-01 + NVIDIA GeForce RTX 3060 SPECviewperf 12 - specvp12 creo-01
min: 45.4 avg: 52 median: 51.3 (21%) max: 57.9 fps
GPU TDP ? TDP 170 W 100% 96%
specvp12 catia-04 + NVIDIA GeForce RTX 3060 SPECviewperf 12 - specvp12 catia-04
min: 63.1 avg: 75.1 median: 75.8 (13%) max: 84.5 fps
GPU TDP ? TDP 170 W 100% 99%
specvp12 3dsmax-05 + NVIDIA GeForce RTX 3060 SPECviewperf 12 - specvp12 3dsmax-05
min: 98 avg: 192 median: 207.5 (31%) max: 225 fps
GPU TDP ? TDP 170 W 100% 83%
SPECviewperf 13 specvp13 sw-04 + NVIDIA GeForce RTX 3060 SPECviewperf 13 - specvp13 sw-04
min: 73.2 avg: 96.5 median: 102 (27%) max: 110 fps
GPU TDP ? TDP 170 W 100% 98%
specvp13 snx-03 + NVIDIA GeForce RTX 3060 SPECviewperf 13 - specvp13 snx-03
min: 13.4 avg: 16.3 median: 16 (2%) max: 18.8 fps
GPU TDP ? TDP 170 W 100% 97%
specvp13 showcase-02 + NVIDIA GeForce RTX 3060 SPECviewperf 13 - specvp13 showcase-02
min: 72.9 avg: 108.3 median: 114.5 (20%) max: 118 fps
GPU TDP ? TDP 170 W 100% 88%
specvp13 medical-02 + NVIDIA GeForce RTX 3060 SPECviewperf 13 - specvp13 medical-02
min: 44.9 avg: 52.8 median: 54.7 (9%) max: 55.7 fps
GPU TDP ? TDP 170 W 100% 91%
specvp13 maya-05 + NVIDIA GeForce RTX 3060 SPECviewperf 13 - specvp13 maya-05
min: 141 avg: 249 median: 264 (30%) max: 283 fps
GPU TDP ? TDP 170 W 100% 85%
specvp13 energy-02 + NVIDIA GeForce RTX 3060 SPECviewperf 13 - specvp13 energy-02
min: 13.1 avg: 14.3 median: 13.7 (4%) max: 18 fps
GPU TDP ? TDP 170 W 92% 100%
specvp13 creo-02 + NVIDIA GeForce RTX 3060 SPECviewperf 13 - specvp13 creo-02
min: 111 avg: 172.2 median: 181.5 (27%) max: 196 fps
GPU TDP ? TDP 170 W 100% 86%
specvp13 catia-05 + NVIDIA GeForce RTX 3060 SPECviewperf 13 - specvp13 catia-05
min: 92.9 avg: 105.7 median: 106.5 (12%) max: 115 fps
GPU TDP ? TDP 170 W 100% 97%
specvp13 3dsmax-06 + NVIDIA GeForce RTX 3060 SPECviewperf 13 - specvp13 3dsmax-06
min: 97.7 avg: 191.1 median: 204.5 (32%) max: 229 fps
GPU TDP ? TDP 170 W 100% 86%
SPECviewperf 2020 specvp2020 snx-04 1080p + NVIDIA GeForce RTX 3060 SPECviewperf 2020 - specvp2020 snx-04 1080p
specvp2020 medical-03 1080p + NVIDIA GeForce RTX 3060 SPECviewperf 2020 - specvp2020 medical-03 1080p
specvp2020 maya-06 1080p + NVIDIA GeForce RTX 3060 SPECviewperf 2020 - specvp2020 maya-06 1080p
specvp2020 energy-03 1080p + NVIDIA GeForce RTX 3060 SPECviewperf 2020 - specvp2020 energy-03 1080p
specvp2020 creo-03 1080p + NVIDIA GeForce RTX 3060 SPECviewperf 2020 - specvp2020 creo-03 1080p
specvp2020 catia-06 1080p + NVIDIA GeForce RTX 3060 SPECviewperf 2020 - specvp2020 catia-06 1080p
specvp2020 3dsmax-07 1080p + NVIDIA GeForce RTX 3060 SPECviewperf 2020 - specvp2020 3dsmax-07 1080p
specvp2020 solidworks-05 4k + NVIDIA GeForce RTX 3060 SPECviewperf 2020 - specvp2020 solidworks-05 4k
min: 79.7 avg: 86 median: 81.7 (20%) max: 105 fps
GPU TDP ? TDP 170 W 88% 100%
specvp2020 snx-04 4k + NVIDIA GeForce RTX 3060 SPECviewperf 2020 - specvp2020 snx-04 4k
min: 12.4 avg: 13.1 median: 12.9 (1%) max: 14.3 fps
GPU TDP ? TDP 170 W 96% 100%
specvp2020 medical-03 4k + NVIDIA GeForce RTX 3060 SPECviewperf 2020 - specvp2020 medical-03 4k
min: 8.39 avg: 11 median: 8.5 (5%) max: 22.2 fps
GPU TDP ? TDP 170 W 63% 100%
specvp2020 maya-06 4k + NVIDIA GeForce RTX 3060 SPECviewperf 2020 - specvp2020 maya-06 4k
min: 141 avg: 160 median: 162.5 (23%) max: 171 fps
GPU TDP ? TDP 170 W 100% 96%
specvp2020 energy-03 4k + NVIDIA GeForce RTX 3060 SPECviewperf 2020 - specvp2020 energy-03 4k
min: 13.1 avg: 22.4 median: 15.3 (2%) max: 38.2 fps
GPU TDP ? TDP 170 W 100% 95%
specvp2020 creo-03 4k + NVIDIA GeForce RTX 3060 SPECviewperf 2020 - specvp2020 creo-03 4k
min: 64 avg: 68.8 median: 68 (30%) max: 75.5 fps
GPU TDP ? TDP 170 W 99% 100%
specvp2020 catia-06 4k + NVIDIA GeForce RTX 3060 SPECviewperf 2020 - specvp2020 catia-06 4k
min: 17.5 avg: 26.9 median: 28.4 (19%) max: 29.6 fps
GPU TDP ? TDP 170 W 100% 88%
specvp2020 3dsmax-07 4k + NVIDIA GeForce RTX 3060 SPECviewperf 2020 - specvp2020 3dsmax-07 4k
min: 64.8 avg: 66.7 median: 65.7 (22%) max: 72.5 fps
GPU TDP ? TDP 170 W 97% 100%
Cinebench R10 Cinebench R10 Shading (32bit) + NVIDIA GeForce RTX 3060 Cinebench R10 - Cinebench R10 Shading (32bit)
min: 6811 avg: 13079 median: 13079 (9%) max: 19347 Points
GPU TDP ? TDP 170 W 100% 35%
Cinebench R11.5 Cinebench R11.5 OpenGL 64 Bit + NVIDIA GeForce RTX 3060 Cinebench R11.5 - Cinebench R11.5 OpenGL 64 Bit
Cinebench R15 + NVIDIA GeForce RTX 3060 Cinebench R15 - Cinebench R15 OpenGL 64 Bit
Cinebench R15 OpenGL 64 Bit + NVIDIA GeForce RTX 3050 6GB Laptop GPU min: 117.6 avg: 195.4 median: 221 (13%) max: 222 fps
GPU TDP 50 W TDP 60 W TDP 63 W TDP 65 W TDP 170 W 90% 90% 48% 90% 100%
Cinebench R15 OpenGL Ref. Match 64 Bit + NVIDIA GeForce RTX 3060 Cinebench R15 - Cinebench R15 OpenGL Ref. Match 64 Bit
Cinebench R15 OpenGL Ref. Match 64 Bit + NVIDIA GeForce RTX 3050 6GB Laptop GPU GPU TDP 50 W TDP 60 W TDP 63 W TDP 65 W TDP 170 W 100% 100% 100% 100% 100%
Basemark GPU 1.2 - Basemark GPU 1.2 Vulkan Official Medium Offscreen 1080
min: 104.6 avg: 169.5 median: 142.2 (3%) max: 289 fps
GPU TDP 50 W TDP 60 W TDP 63 W TDP 65 W TDP 170 W 29% 10% 10% 18% 100%
Basemark GPU 1.2 - Basemark GPU 1.2 Vulkan Official High Offscreen 2160
GPU TDP 63 W TDP 65 W TDP 170 W 4% 4% 100%
Geekbench 6.5 - Geekbench 6.5 GPU OpenCL
min: 52427 avg: 53532 median: 53414 (14%) max: 54754 Points
GPU TDP 50 W TDP 60 W TDP 65 W TDP 170 W 56% 58% 57% 100%
Geekbench 6.5 - Geekbench 6.5 GPU Vulkan
min: 18152 avg: 30115 median: 20847 (5%) max: 51347 Points
GPU TDP 50 W TDP 60 W TDP 65 W TDP 170 W 23% 20% 58% 100%
LuxMark v2.0 64Bit - LuxMark v2.0 Room GPU
min: 1647 avg: 2044 median: 1849.5 (7%) max: 2954 Samples/s
GPU TDP ? TDP 170 W 78% 100%
LuxMark v2.0 64Bit - LuxMark v2.0 Sala GPU
min: 6513 avg: 7115 median: 6856 (12%) max: 7996 Samples/s
GPU TDP ? TDP 170 W 100% 100%
ComputeMark v2.1 - ComputeMark v2.1 Result
min: 19540 avg: 20361 median: 20449.5 (17%) max: 20905 Points
GPU TDP ? TDP 170 W 99% 100%
Power Consumption - Furmark Stress Test Power Consumption - external Monitor *
min: 252.8 avg: 324.5 median: 296.1 (40%) max: 453 Watt
GPU TDP ? TDP 170 W 100% 129%
min: 76.8 avg: 84.9 median: 83.4 (11%) max: 96.1 Watt
GPU TDP ? TDP 50 W TDP 60 W TDP 63 W TDP 65 W TDP 170 W 100% 179% 177% 182% 182% 129%
Power Consumption - The Witcher 3 Power Consumption - external Monitor *
min: 229.9 avg: 276.1 median: 283.5 (40%) max: 307.5 Watt
GPU TDP ? TDP 170 W 100% 107%
min: 83 avg: 87.2 median: 86.1 (12%) max: 92.6 Watt
GPU TDP ? TDP 50 W TDP 60 W TDP 63 W TDP 170 W 100% 149% 147% 148% 107%
Power Consumption - Witcher 3 Power Consumption *
min: 86.8 avg: 90.8 median: 89.5 (20%) max: 96.2 Watt
GPU TDP 50 W TDP 60 W TDP 63 W 103% 100% 102%
Power Consumption - Power Efficiency - Witcher 3 ultra
min: 0.503 avg: 0.5 median: 0.5 (47%) max: 0.591 fps per Watt
GPU TDP 50 W TDP 60 W TDP 63 W 85% 88% 100%
Power Consumption - Power Efficiency - Witcher 3 ultra external Monitor
min: 0.2059 avg: 0.3 median: 0.3 (27%) max: 0.332 fps per Watt
GPU TDP ? TDP 170 W 82% 100%
min: 0.527 avg: 0.6 median: 0.5 (45%) max: 0.614 fps per Watt
GPU TDP ? TDP 50 W TDP 60 W TDP 63 W TDP 170 W 44% 86% 88% 100% 53%
Power Consumption - Cyberpunk 2077 Power Consumption 150cd *
Power Consumption - Cyberpunk 2077 Power Consumption - external Monitor *
GPU TDP 65 W TDP 170 W 147% 100%
Emissions Witcher 3 Fan Noise + NVIDIA GeForce RTX 3050 6GB Laptop GPU Emissions - Witcher 3 Fan Noise
min: 42.1 avg: 44.9 median: 43.8 (63%) max: 48.7 dB(A)
GPU TDP 50 W TDP 60 W TDP 63 W 100% 86% 90%
Average Benchmarks NVIDIA GeForce RTX 3060 → 100% n=20 Average Benchmarks NVIDIA GeForce RTX 3050 6GB Laptop GPU → 52% n=20
- Bereich der Benchmarkergebnisse für diese Grafikkarte
- Durchschnittliche Benchmarkergebnisse für diese Grafikkarte
* Smaller numbers mean a higher performance
1 This benchmark is not used for the average calculation
Die folgenden Benchmarks basieren auf unseren Spieletests mit Testnotebooks. Die Performance dieser Grafikkarte bei den gelisteten Spielen ist abhängig von der verwendeten CPU, Speicherausstattung, Treiber und auch Betriebssystem. Dadurch müssen die untenstehenden Werte nicht repräsentativ sein. Detaillierte Informationen über das verwendete System sehen Sie nach einem Klick auf den fps-Wert.
NVIDIA GeForce RTX 3060 NVIDIA GeForce RTX 3050 6GB Laptop GPU low med. high ultra QHD 4K low med. high ultra QHD 4K Borderlands 4 42.5 34.6 26.8 19.6 F1 25 228 183 138 12 7 3 Doom: The Dark Ages 61.7 54.1 49.8 47.9 32 The Elder Scrolls IV Oblivion Remastered 107.8 70.1 47 26.6 18 Assassin's Creed Shadows 47 40 32 23 19 Civilization 7 274 192.8 116.6 69.8 32.9 Monster Hunter Wilds 61.7 50.5 38.4 29.3 17.3 Kingdom Come Deliverance 2 111.2 82 67 48 34.4 19.5 Indiana Jones and the Great Circle 97 67 60 46 27 Stalker 2 64 56 47 39 28 16 Call of Duty Black Ops 6 114 104 69 65 48 30 Until Dawn 119 78 52 37 26 15 God of War Ragnarök 127 102 88 82 61 34 Final Fantasy XVI 65 64 54 49 33 18 Space Marine 2 96 78 75 67 46 24 Star Wars Outlaws 49 45 39 32 22 13 Black Myth: Wukong 75 56 42 22 17 9 Once Human 202 122 105.1 88 56 28 The First Descendant 153 99 81 68 43 23 F1 24 283 248 179 57 37 18 Alan Wake 2 54.1 36.2 18 Cyberpunk 2077 2.2 Phantom Liberty 128 98 83 72 42 18 63 49 41 35 21.3 Baldur's Gate 3 131 100 86.7 85 59 31 59.7 50.3 45.4 44.3 Hogwarts Legacy 56.4 39.7 22 The Witcher 3 v4 211 168.8 136.4 107.5 78.1 44.8 Vampire Bloodhunt 341 185 175.9 170.7 110.8 56.4 Ghostwire Tokyo 139.4 127.3 129.3 127.6 80.6 39 Tiny Tina's Wonderlands 165.7 134.5 92.8 72.4 52.9 28.4 109 87 58 45 Cyberpunk 2077 1.6 79.1 78.1 74.8 64.2 39.1 17.7 80.8 64.2 46.4 38.5 Elex 2 95.6 89.7 79.9 72.8 53.4 30.5 GRID Legends 198.9 160.2 134.2 97.9 79.1 51.2 Elden Ring 60 60 60 59.9 56.8 35.2 Dying Light 2 86 68.9 59.8 42.3 22.5 Rainbow Six Extraction 195 162 157 129 85 44 God of War 142 116 93 63 54 39 Halo Infinite 104 87.7 82.5 69.7 67.2 Farming Simulator 22 269 199 151 125 97.7 61.5 Battlefield 2042 144 116 96.5 84.5 64.3 38.7 Forza Horizon 5 192 124 110 66 57 41 Call of Duty Vanguard 102 113 96.3 86.8 62.2 35.6 Riders Republic 198 124 102 79 64 36 Guardians of the Galaxy 140 132 131 127 87 47 Back 4 Blood 214 191 178 115 57.4 Far Cry 6 156 120 105 93 70 39 Alan Wake Remastered 96.1 91.6 91.4 87 FIFA 22 282 311 306 299 282 201 New World 161 112 105 95.9 65.3 33.7 Deathloop 120 102 87.3 72 51.9 28 F1 2021 356 239 192 96 75 43 218 127.4 104.8 61.9 40 Monster Hunter Stories 2 144 144 144 144 125 Days Gone 203 137 122 89.8 64.8 36.5 Mass Effect Legendary Edition 117 112 114 78.8 Resident Evil Village 341 176 164 138 91.1 47.6 Outriders 122 146 125 104 70.2 36.9 Cyberpunk 2077 1.0 75.7 74.9 69.5 56.3 35.5 16.4 Immortals Fenyx Rising 142 100 99 91 71 45 Yakuza Like a Dragon 134 120 116 101 67.6 34.4 Call of Duty Black Ops Cold War 229 119 106 95.2 66.5 36.6 Assassin´s Creed Valhalla 118 102 85 75 60 38 Dirt 5 270 136 105 81 65 43 Watch Dogs Legion 123 108 94.7 59.1 45.1 26.8 Star Wars Squadrons 473 274 243 230 160 90.2 Mafia Definitive Edition 199 113 103 70.3 37 Crysis Remastered 281 123 77.9 57.5 37.4 22.7 Horizon Zero Dawn 198 142 118 100 77 42 Death Stranding 213 144 134 130 92.9 51.3 F1 2020 315 223 187 130 106 60 Borderlands 3 150 131 101 79 60 32 Control 240 115 84.1 54.2 26.3 Anno 1800 151 149 105 50.7 41.5 22.8 The Division 2 264 160 125 92 63 34 Far Cry New Dawn 136 114 109 97 87 50 Metro Exodus 177 99 74 56 50 32 Shadow of the Tomb Raider 175 133 125 116 80 43 Strange Brigade 432 214 171 149 115 67 237 105 87 76 57.1 Far Cry 5 174 137 128 120 93 48 141 83 77 72 52 X-Plane 11.11 157 141 114 97 117 100 84 Final Fantasy XV Benchmark 194 121 88 66 39 124 67 49 35 Rise of the Tomb Raider 435 267 150 128 56.8 Dota 2 Reborn 212 191 181 168 118 152 136 122 112 The Witcher 3 405 274 163 80 72 69 222 139 86 49 37 GTA V 180 176 165 97 81 82 176 174 116 61 40 NVIDIA GeForce RTX 3060 NVIDIA GeForce RTX 3050 6GB Laptop GPU low med. high ultra QHD 4K low med. high ultra QHD 4K < 30 fps < 60 fps < 120 fps ≥ 120 fps 3 19 55 7 30 41 1 10 41 27 4 15 38 15 9 27 40 3 25 40 11 2 < 30 fps < 60 fps < 120 fps ≥ 120 fps 1 4 7 2 6 4 5 6 1 5 5 1 6
log 09. 09:17:49
#0 ran 0s before starting gpusingle class +0s ... 0s
#1 checking url part for id 10960 +0s ... 0s
#2 checking url part for id 11576 +0s ... 0s
#3 not redirecting to Ajax server +0s ... 0s
#4 did not recreate cache, as it is less than 5 days old! Created at Tue, 07 Oct 2025 05:18:57 +0200 +0s ... 0s
#5 composed specs +0.003s ... 0.003s
#6 did output specs +0s ... 0.003s
#7 start showIntegratedCPUs +0s ... 0.003s
#8 getting avg benchmarks for device 10960 +0.001s ... 0.004s
#9 got single benchmarks 10960 +0.002s ... 0.006s
#10 getting avg benchmarks for device 11576 +0.001s ... 0.007s
#11 got single benchmarks 11576 +0.002s ... 0.009s
#12 got avg benchmarks for devices +0s ... 0.009s
#13 min, max, avg, median took s +0.031s ... 0.04s
#14 before gaming benchmark output +0s ... 0.04s
#15 Got 1093 rows for game benchmarks. +0.036s ... 0.075s
#16 composed SQL query for gamebenchmarks +0s ... 0.075s
#17 got data and put it in $dataArray +0.006s ... 0.081s
#18 benchmarks composed for output. +0.033s ... 0.115s
#19 calculated avg scores. +0s ... 0.115s
#20 return log +0.001s ... 0.116s