Notebookcheck Logo

IMG BXM-8-256 vs IMG BXM-4-64 MC1

IMG BXM-8-256

Imagination IMG BXM-8-256

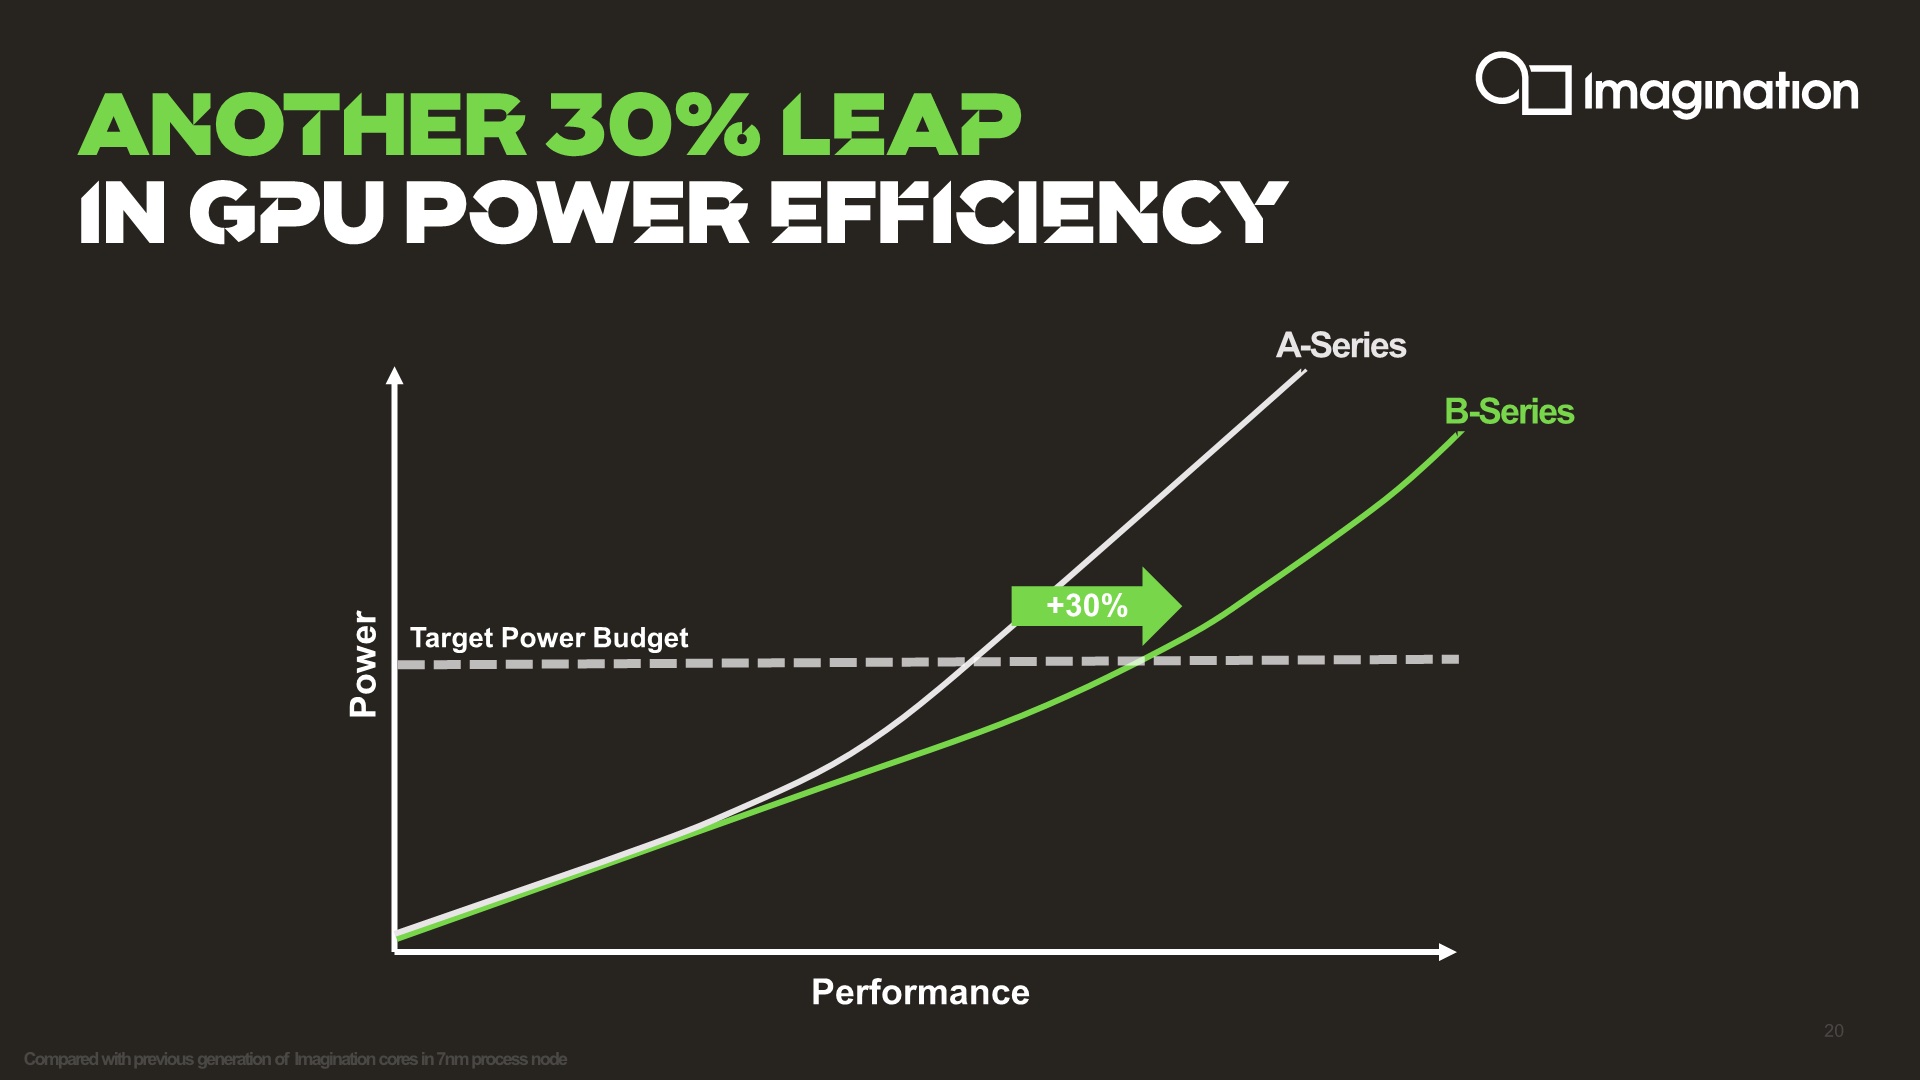
The Imagination IMG BXM-8-256 is an integrated graphics card for ARM-SoCs. It first appeared in the mid-range MediaTek Dimensity 930 (6nm) clocked at up to 900 MHz. The iGPU is based on the B-Series architecture that should be about 30% more power efficient than the previous generation (PowerVR). According to Imagination the BXM-8-256 MC1 (single core) offers 8 texels / clock and 256 FP32 / clock. The wavefront width is 128 Bit.

The GPU supports OpenGL ES 3.X, Vulkan 1.3, OpenCL 3.0, and Android NN HAL.

IMG BXM-4-64 MC1

► remove from comparison Imagination IMG BXM-4-64 MC1

The Imagination Technologies IMG BXM-4-64 MC1 is an integrated mid-range graphics unit for ARM SoCs, which was introduced at the end of 2020 and found in the Allwinner A733 (12nm) smartphone and tablet chip, for example.

The IMG BXM-4-64 MC1 is optimized for efficient performance and is based on the PowerVR B-Series architecture. According to the manufacturer, it achieves up to 30 percent lower power consumption than previous IMG GPUs.

According to Imagination, the BXM-4-64 MC1 (single core) delivers 4 texels/clock and 64 FP32/clock. The wavefront width is 32 bits.

The graphics APIs OpenGL ES 3.X, Vulkan 1.3, OpenCL 3.0 and Android NN HAL are supported.

IMG BXM-8-256IMG BXM-4-64 MC1
IMG B-Series Series
IMG BXM-8-256 @ 0.9 GHz64 Bit
IMG BXM-4-64 MC1
IMG BXM-8-256 @ 0.9 GHz64 Bit
IMG BXM-4-64 MC1
CodenameB-SeriesB-Series
ArchitectureB-SeriesB-Series
Core Speed900 MHz
Memory Bus Width64 Bit
Shared Memorynono
APIOpenGL ES 3.x, OpenCL 3.0, Vulkan 1.3OpenGL ES 3.x, OpenCL 3.0, Vulkan 1.3
technology6 nm12 nm
Date of Announcement09.09.2014 09.09.2014
Link to Manufacturer Pagewww.imaginationtech.comwww.imaginationtech.com
CPU in IMG BXM-8-256GPU Base SpeedGPU Boost / Turbo
MediaTek Dimensity 70258 x 2000 MHz? MHz? MHz
MediaTek Dimensity 70208 x 2000 MHz? MHz? MHz
MediaTek Dimensity 9308 x 2000 MHz? MHz900 MHz
min. - max.? MHz900 MHz
CPU in IMG BXM-4-64 MC1GPU Base SpeedGPU Boost / Turbo
Allwinner A7339 x ? MHz? MHz? MHz

Benchmarks

3DMark - 3DMark Sling Shot (ES 3.0) Unlimited
min: 3172     avg: 3338     median: 3419 (15%)     max: 3423 Points
3DMark - 3DMark Sling Shot (ES 3.0) Unlimited Graphics
min: 3278     avg: 3365     median: 3404 (7%)     max: 3413 Points
3DMark - 3DMark Sling Shot Extreme (ES 3.1) Unlimited
min: 2455     avg: 2527     median: 2551 (11%)     max: 2589 Points
800 Points (3%)
3DMark - 3DMark Sling Shot Extreme (ES 3.1) Unlimited Graphics
min: 2265     avg: 2340     median: 2344 (6%)     max: 2416 Points
662 Points (2%)
3DMark - 3DMark Sling Shot (ES 3.0)
min: 3172     avg: 3330     median: 3378 (30%)     max: 3440 Points
3DMark - 3DMark Sling Shot (ES 3.0) Graphics
min: 3221     avg: 3385     median: 3445 (21%)     max: 3488 Points
3DMark - 3DMark Sling Shot Extreme (ES 3.1)
min: 2386     avg: 2508     median: 2553 (13%)     max: 2586 Points
3DMark - 3DMark Sling Shot Extreme (ES 3.1) Graphics
min: 2368     avg: 2409     median: 2420 (8%)     max: 2440 Points
3DMark - 3DMark Wild Life Unlimited
0 Points (0%)
468 Points (0%)
3DMark - 3DMark Wild Life Extreme Unlimited
0 Points (0%)
min: 122     avg: 123     median: 123 (0%)     max: 124 Points
GFXBench - GFXBench 5.0 4K Aztec Ruins High Tier Offscreen
min: 2.6     avg: 2.9     median: 3 (1%)     max: 3 fps
min: 0.81     avg: 0.9     median: 0.9 (0%)     max: 0.89 fps
GFXBench - GFXBench 5.0 Aztec Ruins High Tier Offscreen
min: 6.6     avg: 6.9     median: 7 (1%)     max: 7.1 fps
min: 2     avg: 2.1     median: 2.1 (0%)     max: 2.1 fps
GFXBench - GFXBench 5.0 Aztec Ruins Normal Tier Offscreen
min: 20     avg: 20.2     median: 20 (1%)     max: 21 fps
min: 5.6     avg: 5.7     median: 5.7 (0%)     max: 5.8 fps
GFXBench - GFXBench Car Chase Offscreen
min: 17     avg: 18     median: 18 (2%)     max: 19 fps
min: 4     avg: 4.5     median: 4.5 (0%)     max: 4.9 fps
GFXBench 3.1 - GFXBench Manhattan ES 3.1 Offscreen
min: 25     avg: 31.4     median: 34 (1%)     max: 35 fps
min: 9.8     avg: 10.4     median: 10.4 (0%)     max: 11 fps
GFXBench 3.0 - GFXBench 3.0 Manhattan Offscreen
min: 61     avg: 62.2     median: 62 (3%)     max: 63 fps
15 fps (1%)
GFXBench (DX / GLBenchmark) 2.7
GFXBench T-Rex HD Offscreen C24Z16 + IMG BXM-8-256
GFXBench (DX / GLBenchmark) 2.7 - GFXBench T-Rex HD Offscreen C24Z16
min: 72     avg: 73.4     median: 74 (1%)     max: 74 fps
GFXBench T-Rex HD Offscreen C24Z16 + IMG BXM-4-64 MC1
min: 24     avg: 25.5     median: 25.5 (0%)     max: 27 fps
Antutu v9 - AnTuTu v9 GPU
min: 97300     avg: 99703     median: 99542 (10%)     max: 102429 Points
Antutu v10 - AnTuTu v10 GPU
min: 50589     avg: 64800     median: 64800 (5%)     max: 79011 Points
min: 24250     avg: 24354     median: 24354 (2%)     max: 24458 Points
Basemark GPU 1.2 - Basemark GPU 1.2 Vulkan Official Medium Offscreen 1080
min: 30.78     avg: 33.2     median: 33.3 (1%)     max: 35.64 fps
9.4 fps (0%)
Geekbench 6.4 - Geekbench 6.4 GPU OpenCL
min: 139     avg: 148     median: 148 (0%)     max: 157 Points
Geekbench 6.4 - Geekbench 6.4 GPU Vulkan
min: 134     avg: 143     median: 143 (0%)     max: 152 Points
202 Points (0%)
PassMark PerformanceTest Mobile V1 - PerformanceTest Mobile V1 2D Graphics Tests
24737 Points (8%)
18530 Points (6%)
PassMark PerformanceTest Mobile V1 - PerformanceTest Mobile V1 3D Graphics Tests
11252 Points (19%)
5722 Points (9%)
Power Consumption - GFXBench Aztec Ruins Normal Tier Offscreen Power Consumption 150cd *
min: 2.91     avg: 4.2     median: 3.6 (1%)     max: 7.46 Watt
4.4 Watt (2%)

Average Benchmarks IMG BXM-8-256 → 100% n=14

Average Benchmarks IMG BXM-4-64 MC1 → 42% n=14

- Range of benchmark values for this graphics card
red legend - Average benchmark values for this graphics card
* Smaller numbers mean a higher performance
1 This benchmark is not used for the average calculation

Game Benchmarks

The following benchmarks stem from our benchmarks of review laptops. The performance depends on the used graphics memory, clock rate, processor, system settings, drivers, and operating systems. So the results don't have to be representative for all laptops with this GPU. For detailed information on the benchmark results, click on the fps number.

Genshin Impact

Genshin Impact

2020
low
100%
IMG BXM-8-256:
35 37.9 ~ 36 fps
50%
IMG BXM-4-64 MC1:
17.2 19.7 ~ 18 fps
med.
IMG BXM-4-64 MC1:
10.2  fps
ultra
100%
IMG BXM-8-256:
24 24.7 ~ 24 fps
50%
IMG BXM-4-64 MC1:
12.1  fps
Armajet

Armajet

2020
high
100%
IMG BXM-8-256:
60 82 ~ 71 fps
PUBG Mobile

PUBG Mobile

2018
low
100%
IMG BXM-8-256:
39.7 40 ~ 40 fps
70%
IMG BXM-4-64 MC1:
25.8 29.9 ~ 28 fps
med.
100%
IMG BXM-8-256:
29  fps
high
100%
IMG BXM-8-256:
29.8 30 30 30 39 ~ 32 fps
88%
IMG BXM-4-64 MC1:
26.2 29.8 ~ 28 fps
Dead Trigger 2

Dead Trigger 2

2013
high
100%
IMG BXM-8-256:
115  fps
Asphalt 9: Legends

Asphalt 9: Legends

2013
low
100%
IMG BXM-8-256:
30 59 ~ 45 fps
high
100%
IMG BXM-8-256:
58.1  fps
Subway Surfers

Subway Surfers

2012
high
100%
IMG BXM-8-256:
90 120 ~ 105 fps

Average Gaming IMG BXM-8-256 → 100%

Average Gaming 30-70 fps → 100%

Average Gaming IMG BXM-4-64 MC1 → 64%

IMG BXM-8-256IMG BXM-4-64 MC1
lowmed.highultraQHD4Klowmed.highultraQHD4K
Genshin Impact36241810.212.1
Armajet71
PUBG Mobile4029322828
Dead Trigger 2115
Asphalt 9: Legends4558.1
Subway Surfers105
IMG BXM-8-256IMG BXM-4-64 MC1
lowmed.highultraQHD4Klowmed.highultraQHD4K
< 30 fps
< 60 fps
< 120 fps
≥ 120 fps

3

1


2
3
1


< 30 fps
< 60 fps
< 120 fps
≥ 120 fps
2


1


1


1


For more games that might be playable and a list of all games and graphics cards visit our Gaming List

Add one or more devices and compare

In the following list you can select (and also search for) devices that should be added to the comparison. You can select more than one device.

restrict list:
v1.33
log 04. 09:46:47

#0 ran 0s before starting gpusingle class +0s ... 0s

#1 checking url part for id 11586 +0s ... 0s

#2 checking url part for id 12993 +0s ... 0s

#3 not redirecting to Ajax server +0s ... 0s

#4 did not recreate cache, as it is less than 5 days old! Created at Fri, 04 Jul 2025 05:20:53 +0200 +0s ... 0s

#5 composed specs +0.016s ... 0.017s

#6 did output specs +0s ... 0.017s

#7 start showIntegratedCPUs +0s ... 0.017s

#8 getting avg benchmarks for device 11586 +0.016s ... 0.033s

#9 got single benchmarks 11586 +0.009s ... 0.042s

#10 getting avg benchmarks for device 12993 +0s ... 0.042s

#11 got single benchmarks 12993 +0.004s ... 0.046s

#12 got avg benchmarks for devices +0s ... 0.046s

#13 No cached benchmark found, getting uncached values +0.005s ... 0.05s

#14 No cached benchmark found, getting uncached values +0.001s ... 0.051s

#15 min, max, avg, median took s +0.011s ... 0.062s

#16 before gaming benchmark output +0s ... 0.062s

#17 Got 28 rows for game benchmarks. +0.004s ... 0.066s

#18 composed SQL query for gamebenchmarks +0s ... 0.066s

#19 got data and put it in $dataArray +0s ... 0.067s

#20 benchmarks composed for output. +0.002s ... 0.069s

#21 calculated avg scores. +0s ... 0.069s

#22 return log +0.001s ... 0.069s

Please share our article, every link counts!
Mail Logo
> Expert Reviews and News on Laptops, Smartphones and Tech Innovations > Benchmarks / Tech > Graphics Card Comparison - Head 2 Head
Redaktion, 2017-09- 8 (Update: 2023-07- 1)