Notebookcheck Logo

Intel HD Graphics (Bay Trail) vs Intel HD Graphics (Haswell) vs Intel HD Graphics 5600

Intel HD Graphics (Bay Trail)

► remove from comparison Intel HD Graphics (Bay Trail)

Die Intel HD Graphics (Bay Trail) ist eine in den Tablet- (z.B. Z3770), Nettop- (z.B. J2850) und Notebook-SoCs (z.B. N3510) der Bay-Trail-Serie integrierte Grafikeinheit. Sie ist in verschiedenen Atom-, Celeron- und Pentium-Modellen zu finden und basiert auf der DirectX-11-tauglichen GPU der Ivy-Bridge-Generation. Taktrate und Einheitenzahl fallen allerdings deutlich niedriger aus, sodass sich die Performance nur im Low-End-Segment ansiedelt.

Im Vergleich zu Ivy Bridge, dessen Gen-7-GPU entweder 6 oder 16 Executions Units bietet, kommt die HD Graphics (Bay Trail) nur mit lediglich 4 EUs daher. Abhängig von Temperatur und Leistungsaufnahme kann die niedrige Basisfrequenz dynamisch bis auf den maximalen Turbo-Takt angehoben werden, der ja nach Modell bei bis zu 896 MHz liegt. Ebenfalls modellabhängig ist das Speicherinterface, welches im Single- oder Dual-Channel-Betrieb sowie mit verschiedene Speicherstandards (DDR3(L), DDR3L-RS, LPDDR3) arbeiten kann. Insbesondere Varianten mit einem nur 32 Bit breiten Interface (Atom Z3735G) verlieren teils erheblich an Performance.

Die schnellsten Notebook-Modelle erreichen knapp die Performance der HD Graphics (Sandy Bridge) sowie der Radeon HD 6310. Das reicht, um einige ältere und sehr anspruchslose Windows-Spiele wie World of Warcraft oder Half-Life 2 in niedrigen Einstellungen flüssig darzustellen. Für aktuelle Windows-Titel ist die GPU dagegen praktisch nicht geeignet.

Verglichen mit konkurrierenden ARM-SoCs ordnet sich die Grafikeinheit dagegen im unteren High-End-Segment ein und übertrifft knapp die Adreno 320, die in verschiedenen Qualcomm-SoCs wie dem Snapdragon 600 zu finden ist. Damit entspricht Grafik-Performance in etwa Nvidias Tegra 4. Auch sehr aufwändige Android-Spiele werden damit in hohen Auflösungen flüssig bewältigt (Stand 2013).

Der integrierte Videodecoder unterstützt alle gängigen Codecs wie MPEG2, H.264, VC1, MVC oder VP8 und ist für Auflösungen bis 4K (maximal 100 Mbit/s) geeignet. Das Bildsignal kann per HDMI 1.4 (max. 1.920 x 1.080) oder DisplayPort 1.2 (max. 2.560 x 1.600) an bis zu zwei Displays ausgegeben werden. Eine weitere Neuerung ist die Unterstützung von Wireless Display sowie Quick Sync, Intels schnellem und sparsamen H-264-Hardwareencoder. Einige dieser Features sind jedoch nicht bei allen Modellen verfügbar.

Je nach Modell liegt die Leistungsaufnahme des gesamten SoCs zwischen rund 2 und 10 Watt. Die besonders sparsamen Versionen sind damit auch für passiv gekühlte Tablets geeignet, andere werden in größeren (Sub-) Notebooks mit aktiver Kühlung eingesetzt.

Intel HD Graphics (Haswell)

► remove from comparison Intel HD Graphics (Haswell)

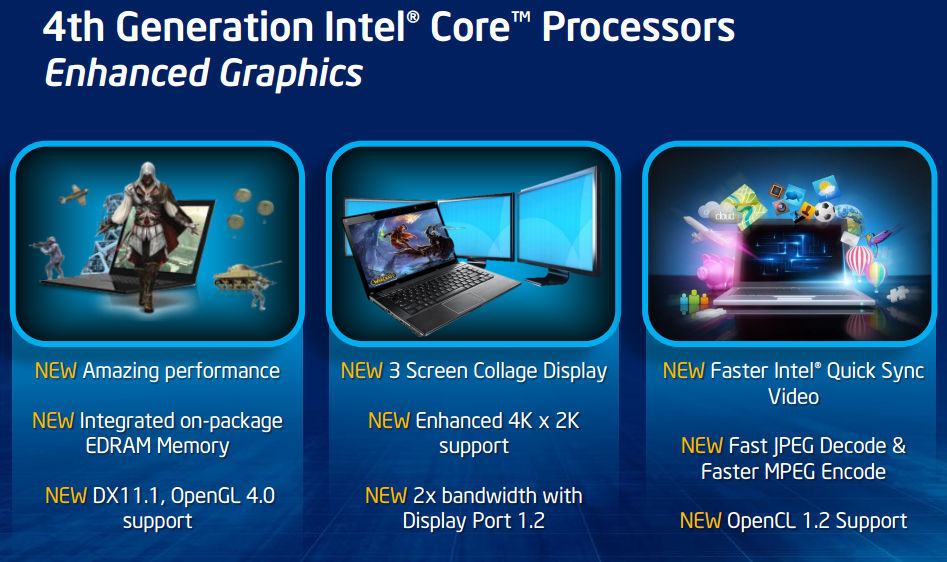
Die Intel HD Graphics ist eine in den Haswell Prozessoren integrierte Grafikkarte. Sie kommt in den mobilen Celeron- und Pentium-Modellen zu Einsatz. Je nach Prozessormodell kann die HD Graphics (auch GT1 genannt) unterschiedlich getaktet sein (typischerweise 200 MHz Basis- und 1.000 MHz Turbo-Takt). Dies sowie die Geschwindigkeit des angebundenen Arbeitsspeichers beeinflusst die Performance entscheidend.

Der Grafikkern wurde im Vergleich zum Intel HD Graphics 4000 der Ivy-Bridge-Generation in verschiedenen Punkten weiterentwickelt. So unterstützt die GPU nun mit DirectX 11.1, OpenCL 1.2 und OpenGL 4.0 alle wichtigen aktuellen Standards. Auch ein verbesserter Decoder für 4K-Videos sowie ein überarbeiteter Quick-Sync-Encoder (bei vielen Einstiegsmodellen deaktiviert) sind mit an Bord.

Die Performance der HD Graphics (Haswell) liegt durch die Beschneidung auf nur noch 10 EUs deutlich unter der HD Graphics 4400/4600 und etwa auf dem Level der älteren HD Graphics 3000 oder AMDs Radeon HD 8250. Nur die wenigsten aktuellen Spiele des Jahres 2013, beispielsweise das sehr anspruchslose Dota 2, können mit niedrigsten Details flüssig dargestellt werden.

Der Stromverbrauch ist dank des 22-Nanometer-Prozesses mit Tri-Gate-Transistoren relativ gering und wird dynamisch vom TDP-Budget des gesamten Chips abgezweigt. Die HD Graphics (Haswell) wird in Dual-Core-Prozessoren der ULV- und regulären 37-Watt-Klasse eingesetzt.

Weitere Details zur Grafikkartenarchitektur der Haswell Generation finden Sie in unserem Artikel zur Haswell-Architektur sowie dem Testbericht der HD Graphics 4600.

Intel HD Graphics 5600

► remove from comparison Intel HD Graphics 5600

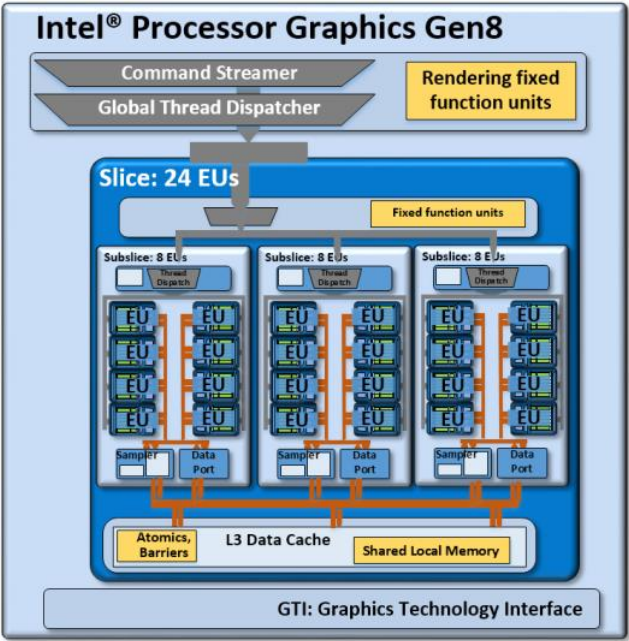
Die Intel HD Graphics 5600 (GT2) ist eine Prozessorgrafikkarte in den CPUs der Broadwell-Generation. Die GPU wird in Standard-Voltage-Modellen der Core-Serie verbaut und bietet 24 EUs (Execution Units bzw. Ausführungseinheiten). Die Kerntaktrate des bislang einzigen Modells (Core i7-5700HQ) liegt bei max. 1.050 MHz mit Turbo.

Architektur und Features

Broadwell integriert eine Grafikeinheit auf Basis der Intel-Gen8-Architektur, die gegenüber dem Vorgänger Intel Gen7.5 (Haswell) in verschiedenen Punkten weiterentwickelt wurde. So hat Intel unter anderem die "Subslice" genannten Shader-Arrays umorganisiert, die nun jeweils 8 Execution Units (EUs) beinhalten. Drei Subslices bilden wiederum einen Slice mit insgesamt 24 EUs. Hinzu kommen größere L1-Caches und Verbesserungen im Front-End, die die Leistung zusätzlich steigern sollen.

Die HD Graphics 5600 repräsentiert die mittlere, auch "GT2" bezeichnete Ausbaustufe der Broadwell-GPU mit einem Slice und 24 EUs. Daneben existieren auch eine teildeaktivierte GT1-Variante (12 EUs) sowie die GT3/GT3e (48 EUs) ohne/mit zusätzlichem eDRAM-Cache.

Alle Broadwell-GPUs unterstützen OpenCL 2.0 sowie DirectX 12 (FL 11_1). Zudem kann der Videodecoder nun auch den H.265-Codec verarbeiten, greift dafür allerdings nur teilweise auf besonders sparsame Fixed-Function-Einheiten zurück. Die Bildausgabe erfolgt über DP 1.2/eDP 1.3 (max. 3.840 x 2.160 @ 60 Hz) oder HDMI 1.4a (max. 3.840 x 2.160 @ 24 Hz), HDMI 2.0 steht dagegen nicht zur Verfügung. Es können maximal drei Displays parallel angesteuert werden.

Performance

Dank zusätzlicher Ausführungseinheiten sowie der verbesserten Architektur liegt die Performance der HD Graphics 5600 etwa 20 Prozent oberhalb des Vorgängers HD Graphics 4600. Dennoch ordnet sich die GPU weiterhin im Low-End-Segment ein und kommt nicht ganz an dedizierte Einstiegsbeschleuniger wie die GeForce 920M oder Radeon R7 M360 heran. Spiele des Jahres 2014/2015 werden darum meist nur in niedrigen Einstellungen flüssig wiedergegeben, einige besonders anspruchsvolle Titel wie The Witcher 3 teilweise nicht einmal das.

Leistungsaufnahme

Die TDP des gesamten Chips liegt standardmäßig bei 47 Watt (i7-5700HQ), sodass die HD Graphics 5600 vor allem in größeren Notebooks ab 14 oder 15 Zoll zu finden ist. Laut HWInfo braucht der GPU Part in einem i7-5700HQ (MSI GP62) auf dem Windows Desktop etwa 0,04 Watt, bei World of Warships 9,6 Watt (41 Watt die gesamte CPU). Verwendet man die dedizierte 940M im GP62, verringern sich die Werte auf 0,4 Watt bzw. 29 Watt für die gesamte CPU.

Intel HD Graphics (Bay Trail)Intel HD Graphics (Haswell)Intel HD Graphics 5600
HD Graphics Serie
HD Graphics P530 24 @ 0.35 - 1.05 GHz64/128 Bit
HD Graphics 5600 24 @ 0.3 - 1.05 GHz64/128 Bit
HD Graphics 6000 48 @ 0.3 - 1 GHz64/128 Bit
HD Graphics 4600 20 @ 0.2 - 1.35 GHz64/128 Bit
HD Graphics 5500 24 @ 0.3 - 0.95 GHz64/128 Bit
HD Graphics 5000 40 @ 0.2 - 1.1 GHz64/128 Bit
HD Graphics 4400 20 @ 0.2 - 1.1 GHz64/128 Bit
HD Graphics 5300 24 @ 0.1 - 0.9 GHz64/128 Bit
HD Graphics 4000 16 @ 0.35 - 1.35 GHz64/128 Bit
HD Graphics (Broadwell) 12 @ 0.1 - 0.85 GHz64/128 Bit
HD Graphics 4200 20 @ 0.2 - 0.85 GHz64/128 Bit
HD Graphics (Skylake) 12 @ 0.3 - 0.8 GHz64/128 Bit
HD Graphics 405 (Braswell) 16 @ 0.32 - 0.7 GHz64/128 Bit
HD Graphics (Braswell) 16 @ 0.32 - 0.7 GHz64/128 Bit
HD Graphics 400 (Braswell) 12 @ 0.32 - 0.64 GHz64/128 Bit
HD Graphics (Haswell) 10 @ 0.2 - 1 GHz64/128 Bit
HD Graphics (Cherry Trail) 16 @ 0.2 - 0.6 GHz64/128 Bit
HD Graphics 3000 12 @ 0.35 - 1.35 GHz64/128 Bit
HD Graphics 2500 6 @ 0.65 - 1.15 GHz64/128 Bit
HD Graphics (Ivy Bridge) 6 @ 0.35 - 1.1 GHz64/128 Bit
HD Graphics 2000 6 @ 0.85 - 1.35 GHz64/128 Bit
HD Graphics (Sandy Bridge) 6 @ 0.35 - 1.1 GHz64/128 Bit
HD Graphics (Bay Trail) 4 @ 0.31 - 0.9 GHz32/64/128 Bit
CodenameBay TrailHaswell GT1Broadwell GT2
ArchitekturGen. 7 Ivy BridgeGen. 7.5 HaswellGen. 8 Broadwell
Pipelines4 - unified10 - unified24 - unified
Kerntakt311 - 896 (Boost) MHz200 - 1000 (Boost) MHz300 - 1050 (Boost) MHz
Speicherbandbreite32/64/128 Bit64/128 Bit64/128 Bit
Shared Memoryjajaja
APIDirectX 11, Shader 5.0, OpenGL 4.0, ES 3.0DirectX 11.1, Shader 5.0DirectX 12 (FL 11_1), OpenGL 4.3
Herstellungsprozess22 nm22 nm14 nm
Erscheinungsdatum11.09.2013 01.10.2012 02.06.2015
FeaturesQuickSync
CPU in HD Graphics (Bay Trail)GPU Base SpeedGPU Boost / Turbo
Intel Pentium N35404 x 2160 MHz, 7.5 W313 MHz896 MHz
Intel Pentium J29004 x 2410 MHz, 10 W688 MHz896 MHz
Intel Pentium N35304 x 2160 MHz, 7.5 W313 MHz896 MHz
min. - max.311 - ? MHz400 - 896 MHz
CPU in HD Graphics (Haswell)GPU Base SpeedGPU Boost / Turbo
Intel Pentium 3560M2 x 2400 MHz, 37 W400 MHz1100 MHz
Intel Pentium 3550M2 x 2300 MHz, 37 W400 MHz1100 MHz
Intel Celeron 2970M2 x 2200 MHz, 37 W400 MHz1100 MHz
min. - max.200 - 400 MHz850 - 1100 MHz
CPU in HD Graphics 5600GPU Base SpeedGPU Boost / Turbo
Intel Core i7-5700HQ4 x 2700 MHz, 47 W300 MHz1050 MHz

Benchmarks

Performance Rating - 3DMark 11 + Fire Strike + Time Spy - HD Graphics (Bay Trail)
0.1 pt (0%)
Restrict / Search: Model: Max. age: years
Performance Rating - 3DMark 11 + Fire Strike + Time Spy - HD Graphics (Haswell)
0.1 pt (0%)
Restrict / Search: Model: Max. age: years
Performance Rating - 3DMark 11 + Fire Strike + Time Spy - HD Graphics 5600
0.4 pt (1%)
Restrict / Search: Model: Max. age: years
43493 Points (4%)
3DMark - 3DMark Cloud Gate Score
min: 354     avg: 1182     median: 1188 (1%)     max: 1703 Points
min: 2141     avg: 2403     median: 2335.5 (2%)     max: 3011 Points
7499 Points (7%)
3DMark - 3DMark Cloud Gate Graphics
min: 362     avg: 1230     median: 1228.5 (0%)     max: 1670 Points
min: 3111     avg: 3415     median: 3278 (1%)     max: 4199 Points
7757 Points (2%)
3DMark - 3DMark Fire Strike Standard Score
min: 83     avg: 185     median: 147 (0%)     max: 495 Points
min: 300     avg: 323.8     median: 314 (0%)     max: 383 Points
944 Points (1%)
min: 340     avg: 370.8     median: 362.5 (0%)     max: 433 Points
991 Points (1%)
3DMark - 3DMark Ice Storm Graphics
min: 5056     avg: 15391     median: 16047 (2%)     max: 21351 Points
min: 29291     avg: 34138     median: 34675 (4%)     max: 40515 Points
79039 Points (9%)
3DMark - 3DMark Sling Shot (ES 3.0)
0 Points (0%)
3DMark - 3DMark Sling Shot Extreme (ES 3.1)
0 Points (0%)
3DMark 11 - 3DM11 Performance Score
min: 143     avg: 222.6     median: 216 (0%)     max: 280 Points
min: 435     avg: 543     median: 544 (1%)     max: 688 Points
1651 Points (2%)
3DMark 11 - 3DM11 Performance GPU
min: 122     avg: 192.1     median: 186.5 (0%)     max: 237 Points
min: 384     avg: 479.6     median: 484 (0%)     max: 602 Points
1431 Points (1%)
3DMark Vantage
3DM Vant. Perf. total + Intel HD Graphics (Bay Trail)
3DMark Vantage - 3DM Vant. Perf. total
min: 507     avg: 666     median: 637 (0%)     max: 846 Points
3DM Vant. Perf. total + Intel HD Graphics (Haswell)
min: 2146     avg: 2163     median: 2163 (1%)     max: 2180 Points
3DM Vant. Perf. GPU no PhysX + Intel HD Graphics (Bay Trail)
3DM Vant. Perf. GPU no PhysX + Intel HD Graphics (Haswell)
min: 1848     avg: 1859     median: 1859 (1%)     max: 1870 Points
3DMark 2001SE - 3DMark 2001 - Standard
7727 Points (8%)
3DMark 03 - 3DMark 03 - Standard
min: 4226     avg: 4997     median: 5220 (3%)     max: 5323 Points
3DMark 05 - 3DMark 05 - Standard
min: 2666     avg: 3195     median: 3331 (4%)     max: 3445 Points
3DMark 06 3DMark 06 - Score Unknown Settings + Intel HD Graphics (Bay Trail)
3DMark 06
2108 Points (3%)
3DMark 06 - Standard 1280x1024 + Intel HD Graphics (Bay Trail)
3DMark 06
min: 814     avg: 1785     median: 1866 (2%)     max: 2151 Points
3DMark 06 - Standard 1280x1024 + Intel HD Graphics (Haswell)
min: 2917     avg: 3274     median: 3357.5 (4%)     max: 3463 Points
3DMark 06 - Standard 1280x800 + Intel HD Graphics (Bay Trail)
3DMark 06
2087 Points (3%)
Unigine Heaven 3.0 - Unigine Heaven 3.0 DX 11
3.6 fps (1%)
Unigine Heaven 2.1 - Heaven 2.1 high
min: 2.4     avg: 2.8     median: 2.8 (1%)     max: 3.4 fps
Windows 7 Experience Index - Win7 Gaming graphics
6.3 Points (80%)
Windows 7 Experience Index - Win7 Graphics
4.7 Points (59%)
Cinebench R10 Cinebench R10 Shading (32bit) + Intel HD Graphics (Bay Trail)
Cinebench R10 - Cinebench R10 Shading (32bit)
min: 898     avg: 2014     median: 1991.5 (1%)     max: 2889 Points
Cinebench R10 Shading (32bit) + Intel HD Graphics (Haswell)
min: 3867     avg: 4235     median: 4215.5 (3%)     max: 4642 Points
Cinebench R10 Shading (32bit) + Intel HD Graphics 5600
7445 Points (5%)
Cinebench R11.5 Cinebench R11.5 OpenGL 64 Bit + Intel HD Graphics (Bay Trail)
Cinebench R11.5 - Cinebench R11.5 OpenGL 64 Bit
min: 0.37     avg: 6.2     median: 6.4 (2%)     max: 7.69 fps
Cinebench R11.5 OpenGL 64 Bit + Intel HD Graphics (Haswell)
min: 9.38     avg: 11.4     median: 11.6 (4%)     max: 12.78 fps
Cinebench R11.5 OpenGL 64 Bit + Intel HD Graphics 5600
41.2 fps (14%)
Cinebench R15
Cinebench R15 OpenGL 64 Bit + Intel HD Graphics (Bay Trail)
Cinebench R15 - Cinebench R15 OpenGL 64 Bit
min: 2.88     avg: 5     median: 5.5 (0%)     max: 6.55 fps
Cinebench R15 OpenGL 64 Bit + Intel HD Graphics (Haswell)
min: 10.28     avg: 13.2     median: 13.9 (1%)     max: 14.59 fps
Cinebench R15 OpenGL 64 Bit + Intel HD Graphics 5600
37.9 fps (2%)
Cinebench R15 OpenGL Ref. Match 64 Bit + Intel HD Graphics (Bay Trail)
Cinebench R15 - Cinebench R15 OpenGL Ref. Match 64 Bit
min: 63     avg: 96.1     median: 97.8 (98%)     max: 97.8 %
Cinebench R15 OpenGL Ref. Match 64 Bit + Intel HD Graphics (Haswell)
GFXBench - GFXBench Car Chase Offscreen
11.6 fps (1%)
GFXBench 3.1 - GFXBench Manhattan ES 3.1 Offscreen
5.2 fps (0%)
20.1 fps (0%)
28.7 fps (1%)
GFXBench (DX / GLBenchmark) 2.7
GFXBench T-Rex HD Offscreen C24Z16 + Intel HD Graphics (Bay Trail)
GFXBench T-Rex HD Offscreen C24Z16 + Intel HD Graphics (Haswell)
53.5 fps (0%)
Basemark ES 2.0 - Basemark ES 2.0
min: 45.08     avg: 49.1     median: 49.1 (81%)     max: 53.1 fps
Basemark X 1.0 - Basemark X 1.0 Off-Screen
10.1 fps (48%)
Basemark X 1.1 - Basemark X 1.1 High Quality
min: 3008     avg: 6663     median: 8456 (19%)     max: 8524 Points
Basemark X 1.1 - Basemark X 1.1 Medium Quality
min: 4802     avg: 12880     median: 14509 (32%)     max: 17701 Points
NenaMark2 - NenaMark2 Score
min: 59     avg: 59.4     median: 59.4 (88%)     max: 59.7 fps
LuxMark v2.0 64Bit - LuxMark v2.0 Room GPU
min: 25     avg: 28.5     median: 27 (0%)     max: 35 Samples/s
min: 77     avg: 93     median: 93 (0%)     max: 109 Samples/s
LuxMark v2.0 64Bit - LuxMark v2.0 Sala GPU
min: 26     avg: 29     median: 29 (0%)     max: 34 Samples/s
min: 115     avg: 140     median: 140 (0%)     max: 165 Samples/s
ComputeMark v2.1 - ComputeMark v2.1 Result
min: 160     avg: 172.8     median: 174 (0%)     max: 192 Points
min: 355     avg: 370     median: 370 (0%)     max: 385 Points
PassMark PerformanceTest Mobile V1 - PerformanceTest Mobile V1 2D Graphics Tests
min: 3822     avg: 4036     median: 3866 (1%)     max: 4588 Points
PassMark PerformanceTest Mobile V1 - PerformanceTest Mobile V1 3D Graphics Tests
min: 1058     avg: 1251     median: 1228 (2%)     max: 1488 Points
Power Consumption - Furmark Stress Test Power Consumption - external Monitor *
43.7 Watt (6%)
57.8 Watt (8%)
Power Consumption - The Witcher 3 Power Consumption - external Monitor *
30.5 Watt (4%)
44.6 Watt (6%)

Average Benchmarks Intel HD Graphics (Bay Trail) → 100% n=10

Average Benchmarks Intel HD Graphics (Haswell) → 229% n=10

Average Benchmarks Intel HD Graphics 5600 → 630% n=10

- Bereich der Benchmarkergebnisse für diese Grafikkarte
red legend - Durchschnittliche Benchmarkergebnisse für diese Grafikkarte
* Smaller numbers mean a higher performance
1 This benchmark is not used for the average calculation

Spiele-Benchmarks

Die folgenden Benchmarks basieren auf unseren Spieletests mit Testnotebooks. Die Performance dieser Grafikkarte bei den gelisteten Spielen ist abhängig von der verwendeten CPU, Speicherausstattung, Treiber und auch Betriebssystem. Dadurch müssen die untenstehenden Werte nicht repräsentativ sein. Detaillierte Informationen über das verwendete System sehen Sie nach einem Klick auf den fps-Wert.

low 1280x720
HD Graphics (Haswell):
0 (!)  fps
HD Graphics 5600:
15.1  fps
Hitman 2

Hitman 2

2018
low 1280x720
HD Graphics (Haswell):
4.9 (!)  fps
HD Graphics 5600:
10.4  fps
low 1280x720
HD Graphics (Haswell):
14.3  fps
med. 1920x1080
HD Graphics (Haswell):
8  fps
low 1280x720
HD Graphics 5600:
8.7  fps
FIFA 18

FIFA 18

2017
low 1280x720
HD Graphics 5600:
71  fps
med. 1920x1080
HD Graphics 5600:
0 (!)  fps
low 1280x720
HD Graphics (Haswell):
5.9  fps
F1 2017

F1 2017

2017
low 1280x720
HD Graphics (Haswell):
13  fps
low 1280x720
100%
HD Graphics (Bay Trail):
26.7  fps
232%
HD Graphics (Haswell):
62  fps
386%
HD Graphics 5600:
103  fps
med. 1366x768
100%
HD Graphics (Bay Trail):
23.4  fps
122%
HD Graphics (Haswell):
28.6  fps
402%
HD Graphics 5600:
94  fps
high 1920x1080
HD Graphics 5600:
42  fps
ultra 1920x1080
HD Graphics 5600:
15.4  fps
Dirt 4

Dirt 4

2017
low 1280x720
100%
HD Graphics (Bay Trail):
6  fps
273%
HD Graphics (Haswell):
16.4  fps
662%
HD Graphics 5600:
39.7  fps
low 1280x720
100%
HD Graphics (Bay Trail):
12.6  fps
358%
HD Graphics (Haswell):
45.1  fps
438%
HD Graphics 5600:
55.2  fps
med. 1920x1080
HD Graphics (Haswell):
15.9  fps
HD Graphics 5600:
28.6  fps
low 1280x720
HD Graphics (Haswell):
0 (!)  fps
HD Graphics 5600:
17.1  fps
For Honor

For Honor

2017
low 1280x720
HD Graphics 5600:
21.9  fps
med. 1920x1080
HD Graphics 5600:
8.5  fps
low 1280x720
HD Graphics (Haswell):
17.8  fps
low 1280x720
HD Graphics 5600:
14.9  fps
med. 1366x768
HD Graphics 5600:
12.3  fps
low 1280x720
HD Graphics 5600:
0 (!)  fps
low 1280x720
HD Graphics (Haswell):
38.6  fps
med. 1366x768
HD Graphics (Haswell):
21.6  fps
HD Graphics 5600:
45.5  fps
high 1920x1080
HD Graphics (Haswell):
6.3  fps
HD Graphics 5600:
18.1  fps
low 1280x720
HD Graphics (Haswell):
14.1  fps
HD Graphics 5600:
29.8  fps
med. 1366x768
HD Graphics 5600:
19.3  fps
high 1920x1080
HD Graphics 5600:
8.8  fps
ultra 1920x1080
HD Graphics 5600:
7.6  fps
Mafia 3

Mafia 3

2016
low 1280x720
HD Graphics 5600:
8.3  fps
FIFA 17

FIFA 17

2016
low 1280x720
HD Graphics 5600:
68 (!)  fps
med. 1366x768
HD Graphics 5600:
50.4 (!)  fps
high 1920x1080
HD Graphics 5600:
28.1 (!)  fps
low 1280x720
HD Graphics (Haswell):
12.4  fps
med. 1366x768
HD Graphics (Haswell):
7.1  fps
Overwatch

Overwatch

2016
low 1280x720
HD Graphics (Haswell):
26.1  fps
HD Graphics 5600:
40  fps
med. 1366x768
HD Graphics (Haswell):
16.3  fps
HD Graphics 5600:
28  fps
Doom

Doom

2016
low 1280x720
HD Graphics (Haswell):
0 (!)  fps
low 1280x768
HD Graphics 5600:
5.8  fps
low 1280x720
HD Graphics (Haswell):
6  fps
low 1280x720
HD Graphics (Haswell):
8.5  fps
HD Graphics 5600:
17.4  fps
low 1280x720
HD Graphics (Haswell):
9  fps
HD Graphics 5600:
16  fps
med. 1920x1080
HD Graphics 5600:
8  fps
XCOM 2

XCOM 2

2016
low 1280x720
HD Graphics 5600:
15.8  fps
low 1024x768
HD Graphics (Haswell):
9.4  fps
HD Graphics 5600:
0 (!)  fps
med. 1366x768
HD Graphics (Haswell):
5.3  fps
high 1920x1080
HD Graphics (Haswell):
2.5  fps
ultra 1920x1080
HD Graphics (Haswell):
1.8  fps
low 1024x768
HD Graphics (Haswell):
13.7  fps
med. 1366x768
HD Graphics (Haswell):
8.9  fps
low 1024x768
HD Graphics (Haswell):
11.7  fps
HD Graphics 5600:
0 (!)  fps
low 1024x768
HD Graphics (Haswell):
0 (!)  fps
Fallout 4

Fallout 4

2015
low 1280x720
HD Graphics 5600:
17.9  fps
low 1024x768
HD Graphics (Bay Trail):
0 (!)  fps
HD Graphics 5600:
31.2  fps
med. 1366x768
HD Graphics 5600:
18.5  fps
FIFA 16

FIFA 16

2015
low 1280x720
HD Graphics 5600:
70  fps
high 1366x768
HD Graphics 5600:
39.8  fps
ultra 1920x1080
HD Graphics 5600:
20.8  fps
low 1366x768
100%
HD Graphics (Bay Trail):
12.1  fps
342%
HD Graphics (Haswell):
41.4  fps
612%
HD Graphics 5600:
74  fps
med. 1366x768
HD Graphics (Haswell):
24.1  fps
HD Graphics 5600:
48  fps
high 1920x1080
HD Graphics (Haswell):
11.4  fps
HD Graphics 5600:
22.9  fps
ultra 1920x1080
HD Graphics 5600:
16.5  fps
low 1024x768
100%
HD Graphics (Bay Trail):
10.8  fps
289%
HD Graphics 5600:
31.2  fps
med. 1366x768
HD Graphics 5600:
20.7  fps
high 1920x1080
HD Graphics 5600:
7.2  fps
Mad Max

Mad Max

2015
med. 1366x768
HD Graphics 5600:
16.4  fps
high 1920x1080
HD Graphics 5600:
7.6  fps
low 1280x720
100%
HD Graphics (Bay Trail):
24.7  fps
med. 1366x768
100%
HD Graphics (Bay Trail):
9.7  fps
high 1920x1080
100%
HD Graphics (Bay Trail):
5.5  fps
ultra 1920x1080
100%
HD Graphics (Bay Trail):
5.4  fps
low 1280x720
HD Graphics 5600:
12  fps
med. 1366x768
HD Graphics 5600:
9  fps
high 1920x1080
HD Graphics 5600:
5  fps
low 1024x768
HD Graphics (Haswell):
8.9  fps
HD Graphics 5600:
14.7  fps
med. 1366x768
HD Graphics (Haswell):
5.2 5.8 ~ 6 fps
HD Graphics 5600:
9.6  fps
high 1920x1080
HD Graphics (Haswell):
3.1  fps
HD Graphics 5600:
5.6  fps
ultra 1920x1080
HD Graphics 5600:
3.1  fps
low 1024x768
100%
HD Graphics (Bay Trail):
22 24.2 ~ 23 fps
228%
HD Graphics (Haswell):
52.4  fps
490%
HD Graphics 5600:
112.7  fps
med. 1366x768
100%
HD Graphics (Bay Trail):
0 (!) 12.5 ~ 6 fps
213%
HD Graphics (Haswell):
12.8  fps
457%
HD Graphics 5600:
27.4  fps
high 1920x1080
HD Graphics 5600:
12.9  fps
ultra 1920x1080
HD Graphics 5600:
12.5  fps
low 1024x768
100%
HD Graphics (Bay Trail):
7.3  fps
218%
HD Graphics (Haswell):
15.9  fps
518%
HD Graphics 5600:
37.8  fps
med. 1366x768
100%
HD Graphics (Bay Trail):
5.1  fps
220%
HD Graphics (Haswell):
11.2  fps
525%
HD Graphics 5600:
26.8  fps
high 1920x1080
HD Graphics 5600:
10.8  fps
ultra 1920x1080
HD Graphics 5600:
6  fps
Evolve

Evolve

2015
low 1024x768
100%
HD Graphics (Bay Trail):
3.2  fps
241%
HD Graphics (Haswell):
7.7  fps
594%
HD Graphics 5600:
19  fps
med. 1366x768
100%
HD Graphics (Bay Trail):
1.7  fps
335%
HD Graphics (Haswell):
5.7  fps
794%
HD Graphics 5600:
13.5  fps
high 1920x1080
HD Graphics 5600:
7.7  fps
ultra 1920x1080
HD Graphics 5600:
6.7  fps
The Crew

The Crew

2014
low 1280x720
100%
HD Graphics (Bay Trail):
8.1  fps
120%
HD Graphics (Haswell):
9.7  fps
med. 1366x768
100%
HD Graphics (Bay Trail):
4.7  fps
179%
HD Graphics (Haswell):
8.4  fps
low 1024x768
100%
HD Graphics (Bay Trail):
7  fps
156%
HD Graphics (Haswell):
10.9  fps
459%
HD Graphics 5600:
32.1  fps
med. 1366x768
100%
HD Graphics (Bay Trail):
4.6  fps
152%
HD Graphics (Haswell):
7  fps
441%
HD Graphics 5600:
20.3  fps
high 1920x1080
HD Graphics 5600:
7.2  fps
ultra 1920x1080
HD Graphics 5600:
4.2  fps
Far Cry 4

Far Cry 4

2014
low 1024x768
100%
HD Graphics (Bay Trail):
5.6  fps
402%
HD Graphics 5600:
22.5  fps
med. 1366x768
100%
HD Graphics (Bay Trail):
3.8  fps
429%
HD Graphics 5600:
16.3  fps
high 1920x1080
HD Graphics 5600:
8.4  fps
ultra 1920x1080
HD Graphics 5600:
6.3  fps
low 1024x768
100%
HD Graphics (Bay Trail):
4.3  fps
0%
HD Graphics 5600:
0 (!)  fps
med. 1366x768
100%
HD Graphics (Bay Trail):
2.4  fps
0%
HD Graphics 5600:
0 (!)  fps
high 1920x1080
HD Graphics 5600:
0 (!)  fps
ultra 1920x1080
HD Graphics 5600:
0 (!)  fps
low 1024x768
HD Graphics 5600:
44.6  fps
med. 1366x768
HD Graphics 5600:
21.8  fps
high 1920x1080
HD Graphics 5600:
9.9  fps
ultra 1920x1080
HD Graphics 5600:
5.2  fps
low 1024x768
100%
HD Graphics (Bay Trail):
9.6 11.5 ~ 11 fps
med. 1366x768
100%
HD Graphics (Bay Trail):
4.3  fps
F1 2014

F1 2014

2014
low 1024x768
100%
HD Graphics (Bay Trail):
12 14 ~ 13 fps
238%
HD Graphics (Haswell):
31  fps
569%
HD Graphics 5600:
74  fps
med. 1366x768
100%
HD Graphics (Bay Trail):
12  fps
167%
HD Graphics (Haswell):
20  fps
408%
HD Graphics 5600:
49  fps
high 1920x1080
HD Graphics 5600:
25  fps
ultra 1920x1080
HD Graphics 5600:
15  fps
low 1024x768
100%
HD Graphics (Bay Trail):
5.2  fps
med. 1366x768
100%
HD Graphics (Bay Trail):
3.6  fps
low 1024x768
100%
HD Graphics (Bay Trail):
3.7  fps
243%
HD Graphics (Haswell):
9  fps
589%
HD Graphics 5600:
21.8  fps
med. 1366x768
100%
HD Graphics (Bay Trail):
2.5  fps
232%
HD Graphics (Haswell):
5.8  fps
560%
HD Graphics 5600:
14  fps
high 1920x1080
HD Graphics 5600:
6.7  fps
ultra 1920x1080
HD Graphics 5600:
6.3  fps
low 1024x768
100%
HD Graphics (Bay Trail):
9.1  fps
237%
HD Graphics (Haswell):
21.6  fps
498%
HD Graphics 5600:
45.3  fps
med. 1366x768
100%
HD Graphics (Bay Trail):
5.1  fps
253%
HD Graphics (Haswell):
12.9  fps
555%
HD Graphics 5600:
28.3  fps
high 1920x1080
HD Graphics 5600:
14.4  fps
ultra 1920x1080
HD Graphics 5600:
10.5  fps
low 1280x720
100%
HD Graphics (Bay Trail):
8.5  fps
159%
HD Graphics (Haswell):
13.5  fps
376%
HD Graphics 5600:
32  fps
med. 1344x756
100%
HD Graphics (Bay Trail):
6.1  fps
136%
HD Graphics (Haswell):
8.3  fps
326%
HD Graphics 5600:
19.9  fps
high 1920x1080
HD Graphics 5600:
10.5  fps
ultra 1920x1080
HD Graphics 5600:
8.3  fps
Fifa 15

Fifa 15

2014
low 1280x720
100%
HD Graphics (Bay Trail):
12.4  fps
132%
HD Graphics (Haswell):
16.4  fps
527%
HD Graphics 5600:
65.3  fps
high 1366x768
100%
HD Graphics (Bay Trail):
8.5  fps
133%
HD Graphics (Haswell):
11.3  fps
538%
HD Graphics 5600:
45.7  fps
ultra 1920x1080
HD Graphics 5600:
24.7  fps
Sims 4

Sims 4

2014
low 1024x768
100%
HD Graphics (Bay Trail):
53.7 56 ~ 55 fps
225%
HD Graphics (Haswell):
123.6  fps
341%
HD Graphics 5600:
187.4  fps
med. 1366x768
100%
HD Graphics (Bay Trail):
6.6 7 ~ 7 fps
374%
HD Graphics (Haswell):
26.2  fps
751%
HD Graphics 5600:
52.6  fps
high 1920x1080
HD Graphics 5600:
25.2  fps
ultra 1920x1080
HD Graphics 5600:
16.8  fps
low 1024x768
100%
HD Graphics (Bay Trail):
8.4  fps
158%
HD Graphics (Haswell):
13.3  fps
med. 1366x768
100%
HD Graphics (Bay Trail):
5.9  fps
164%
HD Graphics (Haswell):
9.7  fps
low 1024x768
100%
HD Graphics (Bay Trail):
31.6 41.8 ~ 37 fps
157%
HD Graphics (Haswell):
58.2  fps
273%
HD Graphics 5600:
101.1  fps
med. 1366x768
100%
HD Graphics (Bay Trail):
12.5 12.5 ~ 13 fps
151%
HD Graphics (Haswell):
19.6  fps
345%
HD Graphics 5600:
44.9  fps
high 1920x1080
HD Graphics 5600:
22.9  fps
ultra 1920x1080
HD Graphics 5600:
12.5  fps
low 1024x768
100%
HD Graphics (Bay Trail):
8.3  fps
27%
HD Graphics (Haswell):
2.2  fps
365%
HD Graphics 5600:
30.3  fps
med. 1366x768
100%
HD Graphics (Bay Trail):
4.6  fps
389%
HD Graphics 5600:
17.9  fps
high 1920x1080
HD Graphics 5600:
5.9  fps
ultra 1920x1080
HD Graphics 5600:
3.8  fps
low 1280x720
100%
HD Graphics (Bay Trail):
11.1  fps
179%
HD Graphics (Haswell):
19.9  fps
med. 1280x720
100%
HD Graphics (Bay Trail):
9.6  fps
146%
HD Graphics (Haswell):
14  fps
low 1024x768
100%
HD Graphics (Bay Trail):
25.2  fps
140%
HD Graphics (Haswell):
35.2  fps
med. 1366x768
100%
HD Graphics (Bay Trail):
9.2  fps
148%
HD Graphics (Haswell):
13.6  fps
high 1366x768
HD Graphics (Haswell):
9  fps
Titanfall

Titanfall

2014
low 1024x768
HD Graphics (Haswell):
23.1  fps
med. 1366x768
HD Graphics (Haswell):
13.7  fps
Thief

Thief

2014
low 1024x768
100%
HD Graphics (Bay Trail):
3.1 5.1 ~ 4 fps
253%
HD Graphics (Haswell):
10.1  fps
693%
HD Graphics 5600:
27.7  fps
med. 1366x768
100%
HD Graphics (Bay Trail):
3.3  fps
173%
HD Graphics (Haswell):
5.7  fps
482%
HD Graphics 5600:
15.9  fps
high 1366x768
HD Graphics 5600:
12.7  fps
ultra 1920x1080
HD Graphics 5600:
6.1  fps
low 1024x768
100%
HD Graphics (Bay Trail):
8.7  fps
med. 1366x768
100%
HD Graphics (Bay Trail):
5.8  fps
low 1024x768
100%
HD Graphics (Bay Trail):
12.8  fps
173%
HD Graphics (Haswell):
22.1  fps
med. 1366x768
100%
HD Graphics (Bay Trail):
6  fps
217%
HD Graphics (Haswell):
13  fps
low 1024x768
HD Graphics (Haswell):
11.1  fps
low 1024x768
100%
HD Graphics (Bay Trail):
7.3  fps
274%
HD Graphics (Haswell):
12.8 27.8 ~ 20 fps
642%
HD Graphics 5600:
46.9  fps
med. 1366x768
HD Graphics (Haswell):
10 18.2 ~ 14 fps
HD Graphics 5600:
30.9  fps
high 1366x768
HD Graphics (Haswell):
11.8  fps
HD Graphics 5600:
18.6  fps
ultra 1920x1080
HD Graphics (Haswell):
3.9  fps
HD Graphics 5600:
6  fps
low 1024x768
100%
HD Graphics (Bay Trail):
14  fps
150%
HD Graphics (Haswell):
21  fps
med. 1366x768
100%
HD Graphics (Bay Trail):
8  fps
150%
HD Graphics (Haswell):
12  fps
F1 2013

F1 2013

2013
low 1024x768
100%
HD Graphics (Bay Trail):
12  fps
225%
HD Graphics (Haswell):
27  fps
med. 1366x768
HD Graphics (Haswell):
18  fps
high 1366x768
HD Graphics (Haswell):
14  fps
Fifa 14

Fifa 14

2013
low 1024x768
100%
HD Graphics (Bay Trail):
12.6 18.7 19.9 29.8 33.6 60 ~ 29 fps
med. 1366x768
100%
HD Graphics (Bay Trail):
10.5 19.5 33 ~ 21 fps
275%
HD Graphics (Haswell):
57.7  fps
high 1366x768
100%
HD Graphics (Bay Trail):
7.8 12.8 22 ~ 14 fps
264%
HD Graphics (Haswell):
37  fps
low 1024x768
100%
HD Graphics (Bay Trail):
7.7  fps
291%
HD Graphics (Haswell):
22.4  fps
med. 1366x768
HD Graphics (Haswell):
16.9  fps
low 1280x720
100%
HD Graphics (Bay Trail):
6.3  fps
222%
HD Graphics (Haswell):
14  fps
med. 1366x768
HD Graphics (Haswell):
7.8  fps
low 1024x768
100%
HD Graphics (Bay Trail):
10.2  fps
156%
HD Graphics (Haswell):
15.9  fps
med. 1366x768
100%
HD Graphics (Bay Trail):
6.1  fps
146%
HD Graphics (Haswell):
8.9  fps
low 1024x768
100%
HD Graphics (Bay Trail):
11  fps
129%
HD Graphics (Haswell):
14.2  fps
med. 1366x768
100%
HD Graphics (Bay Trail):
7.8  fps
147%
HD Graphics (Haswell):
11.5  fps
Dota 2

Dota 2

2013
low 1024x768
100%
HD Graphics (Bay Trail):
18.2 20.8 28.4 31.9 ~ 25 fps
148%
HD Graphics (Haswell):
36.9  fps
med. 1366x768
100%
HD Graphics (Bay Trail):
9.5 10.4 13.7 19.4 ~ 13 fps
186%
HD Graphics (Haswell):
24.2  fps
low 1024x768
100%
HD Graphics (Bay Trail):
4.4  fps
164%
HD Graphics (Haswell):
7.2  fps
GRID 2

GRID 2

2013
low 1024x768
100%
HD Graphics (Bay Trail):
14.1 16.2 17.9 20.4 23.2 ~ 18 fps
211%
HD Graphics (Haswell):
38 38.5 ~ 38 fps
med. 1366x768
100%
HD Graphics (Bay Trail):
12.5 12.6 ~ 13 fps
146%
HD Graphics (Haswell):
18.6 19.6 ~ 19 fps
high 1366x768
HD Graphics (Haswell):
13.2  fps
low 1024x768
100%
HD Graphics (Bay Trail):
5  fps
224%
HD Graphics (Haswell):
11.2  fps
658%
HD Graphics 5600:
32.9  fps
med. 1366x768
HD Graphics 5600:
24  fps
high 1366x768
HD Graphics 5600:
15.8  fps
ultra 1920x1080
HD Graphics 5600:
7.5  fps
low 1280x720
100%
HD Graphics (Bay Trail):
8.4 8.4 10.9 11.4 12.2 13.3 14.2 14.7 15 ~ 12 fps
233%
HD Graphics (Haswell):
23 32.8 ~ 28 fps
480%
HD Graphics 5600:
57.6  fps
med. 1366x768
100%
HD Graphics (Bay Trail):
3.5 5.3 5.6 5.7 6.3 6.8 6.9 7.1 ~ 6 fps
200%
HD Graphics (Haswell):
10.3 14.2 ~ 12 fps
505%
HD Graphics 5600:
30.3  fps
high 1366x768
100%
HD Graphics (Bay Trail):
2.1 4.8 4.9 5.8 5.9 6.2 ~ 5 fps
238%
HD Graphics (Haswell):
11.9  fps
500%
HD Graphics 5600:
25  fps
ultra 1920x1080
100%
HD Graphics (Bay Trail):
1.2  fps
308%
HD Graphics (Haswell):
3.7  fps
625%
HD Graphics 5600:
7.5  fps
low 1024x768
100%
HD Graphics (Bay Trail):
39 56.2 69 ~ 55 fps
175%
HD Graphics (Haswell):
96.5  fps
med. 1366x768
100%
HD Graphics (Bay Trail):
12.3 12.8 14 ~ 13 fps
218%
HD Graphics (Haswell):
28.3  fps
high 1366x768
HD Graphics (Haswell):
15  fps
SimCity

SimCity

2013
low 1024x768
HD Graphics (Haswell):
59.6  fps
med. 1366x768
HD Graphics (Haswell):
11.2  fps
low 1024x768
100%
HD Graphics (Bay Trail):
10 11.7 11.8 12 12.4 12.5 12.5 12.6 12.7 12.9 13.2 13.4 13.7 13.8 14 14.1 14.2 14.4 14.4 14.7 14.8 15 15.3 15.4 15.5 15.5 15.9 15.9 16 16.5 16.9 17.6 18 ~ 14 fps
214%
HD Graphics (Haswell):
28.9 30.2 30.3 30.3 31.8 ~ 30 fps
583%
HD Graphics 5600:
81.6  fps
med. 1366x768
100%
HD Graphics (Bay Trail):
5.1 6.1 6.2 6.4 6.7 6.7 6.9 6.9 7 7 7.1 7.1 7.4 7.4 7.4 7.5 7.5 7.6 7.8 7.9 8 8 8.1 8.1 8.2 8.3 8.4 9.2 10.4 ~ 7 fps
200%
HD Graphics (Haswell):
13.8 14.2 14.3 14.3 14.6 ~ 14 fps
563%
HD Graphics 5600:
39.4  fps
high 1366x768
100%
HD Graphics (Bay Trail):
3.1 4.5 4.6 4.8 4.8 4.8 4.8 4.9 4.9 5.2 5.2 5.4 5.4 6.1 7.3 ~ 5 fps
160%
HD Graphics (Haswell):
8.1 8.2 8.2 8.4 ~ 8 fps
500%
HD Graphics 5600:
25  fps
ultra 1920x1080
100%
HD Graphics (Bay Trail):
0.3  fps
3800%
HD Graphics 5600:
11.4  fps
Crysis 3

Crysis 3

2013
low 1024x768
HD Graphics (Haswell):
12.2  fps
HD Graphics 5600:
30.8  fps
med. 1366x768
HD Graphics (Haswell):
7.6  fps
HD Graphics 5600:
18.8  fps
high 1366x768
HD Graphics 5600:
12.4  fps
ultra 1920x1080
HD Graphics 5600:
4.7  fps
low 1024x768
100%
HD Graphics (Bay Trail):
15.1 23.6 ~ 19 fps
204%
HD Graphics (Haswell):
38.7  fps
med. 1366x768
100%
HD Graphics (Bay Trail):
5.2 9.7 ~ 7 fps
253%
HD Graphics (Haswell):
17.7  fps
high 1366x768
HD Graphics (Haswell):
13.1  fps
Far Cry 3

Far Cry 3

2012
low 1024x768
100%
HD Graphics (Bay Trail):
10.3  fps
182%
HD Graphics (Haswell):
18.7  fps
med. 1366x768
100%
HD Graphics (Bay Trail):
6.2  fps
184%
HD Graphics (Haswell):
11.4  fps
low 1024x768
100%
HD Graphics (Bay Trail):
10.1  fps
122%
HD Graphics (Haswell):
12.3  fps
med. 1366x768
100%
HD Graphics (Bay Trail):
6  fps
165%
HD Graphics (Haswell):
9.9  fps
low 1024x768
100%
HD Graphics (Bay Trail):
12.4  fps
206%
HD Graphics (Haswell):
25.6  fps
med. 1366x768
100%
HD Graphics (Bay Trail):
7.3  fps
241%
HD Graphics (Haswell):
17.6  fps
low 1024x768
100%
HD Graphics (Bay Trail):
12.5 14.3 ~ 13 fps
172%
HD Graphics (Haswell):
22.3  fps
med. 1366x768
100%
HD Graphics (Bay Trail):
9.8 11.2 ~ 11 fps
153%
HD Graphics (Haswell):
16.8  fps
low 1024x768
100%
HD Graphics (Bay Trail):
42  fps
low 1024x768
100%
HD Graphics (Bay Trail):
26.1 46.6 ~ 36 fps
128%
HD Graphics (Haswell):
46.2  fps
med. 1366x768
100%
HD Graphics (Bay Trail):
20 23.9 ~ 22 fps
158%
HD Graphics (Haswell):
34.7  fps
high 1366x768
HD Graphics (Haswell):
22.5  fps
low 1024x768
100%
HD Graphics (Bay Trail):
12.9 13.2 ~ 13 fps
med. 1366x768
100%
HD Graphics (Bay Trail):
7.5 8.1 ~ 8 fps
low 1024x768
100%
HD Graphics (Bay Trail):
28  fps
111%
HD Graphics (Haswell):
31  fps
med. 1366x768
HD Graphics (Haswell):
18.8  fps
high 1366x768
HD Graphics (Haswell):
11.7  fps
low 1024x768
100%
HD Graphics (Bay Trail):
9.2 10.7 14.8 15.6 16.5 18.4 19.3 ~ 15 fps
246%
HD Graphics (Haswell):
36.9  fps
med. 1366x768
100%
HD Graphics (Bay Trail):
6 9.5 10.3 11.4 12 ~ 10 fps
230%
HD Graphics (Haswell):
23  fps
high 1366x768
100%
HD Graphics (Bay Trail):
7.9 9.6 ~ 9 fps
217%
HD Graphics (Haswell):
19.5  fps
ultra 1920x1080
100%
HD Graphics (Bay Trail):
5 5.9 ~ 5 fps
low 1024x768
HD Graphics (Haswell):
12.5  fps
low 1280x720
100%
HD Graphics (Bay Trail):
8.5 12.4 ~ 10 fps
high 1366x768
100%
HD Graphics (Bay Trail):
8.1  fps
Alan Wake

Alan Wake

2012
low 1024x768
100%
HD Graphics (Bay Trail):
5.8  fps
med. 1366x768
100%
HD Graphics (Bay Trail):
2.3  fps
Anno 2070

Anno 2070

2011
low 1024x768
100%
HD Graphics (Bay Trail):
11.8 14.6 15 15.1 15.3 16.1 16.5 16.8 16.8 17.4 17.4 18 18 18.2 19.7 22.8 ~ 17 fps
212%
HD Graphics (Haswell):
36  fps
med. 1366x768
100%
HD Graphics (Bay Trail):
6.3 6.4 6.4 6.8 6.9 7.2 7.5 7.5 7.6 8 8.1 9.3 ~ 7 fps
229%
HD Graphics (Haswell):
16  fps
high 1366x768
100%
HD Graphics (Bay Trail):
3.6 4 4 4.1 5.5 ~ 4 fps
245%
HD Graphics (Haswell):
9.8  fps
ultra 1920x1080
100%
HD Graphics (Bay Trail):
1.1  fps
low 1280x720
100%
HD Graphics (Bay Trail):
11 11.8 ~ 11 fps
200%
HD Graphics (Haswell):
21.7 22.2 ~ 22 fps
med. 1366x768
100%
HD Graphics (Bay Trail):
10  fps
110%
HD Graphics (Haswell):
11.2 11.3 ~ 11 fps
high 1366x768
HD Graphics (Haswell):
6.8  fps
low 1024x768
100%
HD Graphics (Bay Trail):
8  fps
med. 1366x768
100%
HD Graphics (Bay Trail):
4.8  fps
low 1024x768
100%
HD Graphics (Bay Trail):
19.7  fps
187%
HD Graphics (Haswell):
36.8  fps
high 1366x768
HD Graphics (Haswell):
16.7  fps
Dirt 3

Dirt 3

2011
low 800x600
100%
HD Graphics (Bay Trail):
24.1 36.9 ~ 31 fps
167%
HD Graphics (Haswell):
51.9  fps
med. 1024x768
100%
HD Graphics (Bay Trail):
12.9 13.3 ~ 13 fps
211%
HD Graphics (Haswell):
27.4  fps
high 1360x768
HD Graphics (Haswell):
14.8  fps
Total War: Shogun 2

Total War: Shogun 2

2011
low 1024x768
HD Graphics (Haswell):
49.2  fps
Civilization 5

Civilization 5

2010
low 1024x768
100%
HD Graphics (Bay Trail):
9.3  fps
Mafia 2

Mafia 2

2010
low 800x600
100%
HD Graphics (Bay Trail):
5 10.5 ~ 8 fps
med. 1024x768
100%
HD Graphics (Bay Trail):
5.6  fps
high 1360x768
100%
HD Graphics (Bay Trail):
3.7  fps
low 1024x768
100%
HD Graphics (Bay Trail):
32 48 49 53.3 ~ 46 fps
med. 1360x768
100%
HD Graphics (Bay Trail):
6 9 9 ~ 8 fps
high 1360x768
100%
HD Graphics (Bay Trail):
3  fps
low 800x600
100%
HD Graphics (Bay Trail):
12  fps
med. 1360x768
100%
HD Graphics (Bay Trail):
9  fps
low 1024x768
100%
HD Graphics (Bay Trail):
12.8  fps
219%
HD Graphics (Haswell):
28  fps
med. 1366x768
100%
HD Graphics (Bay Trail):
9  fps
236%
HD Graphics (Haswell):
21.2  fps
Risen

Risen

2009
low 800x600
100%
HD Graphics (Bay Trail):
23.1 25 26.2 28.8 ~ 26 fps
med. 1024x768
100%
HD Graphics (Bay Trail):
8.7 9 10.4 11.1 ~ 10 fps
Resident Evil 5

Resident Evil 5

2009
low 800x600
100%
HD Graphics (Bay Trail):
17.1 26.1 26.2 26.3 ~ 24 fps
178%
HD Graphics (Haswell):
42.6  fps
high 1360x768
HD Graphics (Haswell):
17.8  fps
Trackmania Nations Forever

Trackmania Nations Forever

2008
low 640x480
100%
HD Graphics (Bay Trail):
42.9 69.8 69.8 71.6 72 72.7 75.1 75.5 76 76.7 77.1 80.9 83.1 83.9 84.3 84.8 85.6 86.9 90.2 ~ 77 fps
147%
HD Graphics (Haswell):
113  fps
high 1024x768
100%
HD Graphics (Bay Trail):
10.3 14 17.7 18 18.1 18.1 18.7 18.8 19.3 19.4 19.4 19.8 19.8 20.5 20.5 20.6 21 21.5 23.6 ~ 19 fps
237%
HD Graphics (Haswell):
45.1  fps
ultra 1920x1080
100%
HD Graphics (Bay Trail):
6.4 7.7 ~ 7 fps
Crysis - GPU Benchmark

Crysis - GPU Benchmark

2007
low 1024x768
100%
HD Graphics (Bay Trail):
18.9 19 ~ 19 fps
med. 1024x768
100%
HD Graphics (Bay Trail):
7.6 8.7 ~ 8 fps
World of Warcraft

World of Warcraft

2005
low 800x600
100%
HD Graphics (Bay Trail):
33 33 35 38 44 46.2 47 48 49 49 50 52 ~ 44 fps
213%
HD Graphics (Haswell):
93.7  fps
med. 1024x768
100%
HD Graphics (Bay Trail):
9.6 11.5 20 22 23 25.3 26 26 28 34 ~ 23 fps
170%
HD Graphics (Haswell):
39.2  fps
high 1280x1024
100%
HD Graphics (Bay Trail):
12 12 13.5 ~ 13 fps
ultra 1920x1080
100%
HD Graphics (Bay Trail):
5.6 7 ~ 6 fps
Quake 3 Arena - Timedemo

Quake 3 Arena - Timedemo

1999
high 1024x768
100%
HD Graphics (Bay Trail):
190  fps

Average Gaming Intel HD Graphics (Bay Trail) → 100%

Average Gaming 30-70 fps → 100%

Average Gaming Intel HD Graphics (Haswell) → 198%

Average Gaming 30-70 fps → 209%

Average Gaming Intel HD Graphics 5600 → 551%

Average Gaming 30-70 fps → 501%

Intel HD Graphics (Bay Trail)Intel HD Graphics (Haswell)Intel HD Graphics 5600
lowmed.highultraQHD4Klowmed.highultraQHD4Klowmed.highultraQHD4K
Fallout 7615.1
Hitman 24.910.4
X-Plane 11.1114.38
Ark Survival Evolved5.9
F1 201713
Team Fortress 226.723.46228.6103944215.4
Dirt 4616.439.7
Rocket League12.645.115.955.228.6
Mass Effect Andromeda17.1
Resident Evil 717.8
Farming Simulator 1738.621.66.345.518.1
Battlefield 114.129.819.38.87.6
Mirror's Edge Catalyst12.47.1
Overwatch26.116.34028
Doom
Hitman 20166
The Division8.517.4
Far Cry Primal9168
Rise of the Tomb Raider9.45.32.51.80
Rainbow Six Siege13.78.9
Just Cause 311.70
Star Wars Battlefront0
World of Warships12.141.424.111.4744822.916.5
The Witcher 38.963.114.79.65.63.1
Dirt Rally23652.412.8112.727.412.912.5
Battlefield Hardline7.35.115.911.237.826.810.86
Evolve3.21.77.75.71913.57.76.7
The Crew8.14.79.78.4
Dragon Age: Inquisition74.610.9732.120.37.24.2
F1 20141312312074492515
Ryse: Son of Rome3.72.595.821.8146.76.3
Alien: Isolation9.15.121.612.945.328.314.410.5
Middle-earth: Shadow of Mordor8.56.113.58.33219.910.58.3
Fifa 1512.48.516.411.365.345.724.7
Sims 4557123.626.2187.452.625.216.8
Risen 3: Titan Lords8.45.913.39.7
GRID: Autosport371358.219.6101.144.922.912.5
Watch Dogs8.34.62.230.317.95.93.8
Wolfenstein: The New Order11.19.619.914
The Elder Scrolls Online25.29.235.213.69
Titanfall23.113.7
Thief43.310.15.727.715.912.76.1
X-Plane 10.2512.8622.113
Need for Speed: Rivals11.1
Battlefield 47.3201411.83.946.930.918.66
Batman: Arkham Origins1482112
F1 201312271814
Fifa 1429211457.737
Total War: Rome II7.722.416.9
Saints Row IV6.3147.8
The Bureau: XCOM Declassified10.26.115.98.9
Splinter Cell: Blacklist117.814.211.5
Dota 2251336.924.2
Company of Heroes 24.47.2
GRID 21813381913.2
Metro: Last Light511.232.92415.87.5
BioShock Infinite12651.2281211.93.757.630.3257.5
StarCraft II: Heart of the Swarm551396.528.315
SimCity59.611.2
Tomb Raider14750.33014881.639.42511.4
Crysis 312.27.630.818.812.44.7
Dead Space 319738.717.713.1
Far Cry 310.36.218.711.4
Hitman: Absolution10.1612.39.9
Call of Duty: Black Ops 212.47.325.617.6
Dishonored131122.316.8
Counter-Strike: GO362246.234.722.5
Dirt Showdown283118.811.7
Diablo III15109536.92319.5
Risen 2: Dark Waters12.5
Anno 207017741.136169.8
The Elder Scrolls V: Skyrim111022116.8
Deus Ex Human Revolution19.736.816.7
Dirt 3311351.927.414.8
Total War: Shogun 249.2
Battlefield: Bad Company 212.892821.2
Resident Evil 52442.617.8
Trackmania Nations Forever7719711345.1
World of Warcraft442313693.739.2
Intel HD Graphics (Bay Trail)Intel HD Graphics (Haswell)Intel HD Graphics 5600
lowmed.highultraQHD4Klowmed.highultraQHD4Klowmed.highultraQHD4K
< 30 fps
< 60 fps
< 120 fps
≥ 120 fps
46
6
1
39


8


6


< 30 fps
< 60 fps
< 120 fps
≥ 120 fps
49
20
4
1
52
3

21
2

3


< 30 fps
< 60 fps
< 120 fps
≥ 120 fps
10
12
7
1
16
8
1
21
2

22


Eine Liste mit weiteren Spielen und allen Grafikkarten finden Sie auf unserer Seite: Welches Spiel ist mit welcher Grafikkarte spielbar?

v1.33
log 28. 15:41:13

#0 ran 0s before starting gpusingle class +0s ... 0s

#1 checking url part for id 4922 +0s ... 0s

#2 checking url part for id 4622 +0s ... 0s

#3 checking url part for id 5949 +0s ... 0s

#4 not redirecting to Ajax server +0s ... 0s

#5 did not recreate cache, as it is less than 5 days old! Created at Mon, 28 Apr 2025 05:17:03 +0200 +0s ... 0s

#6 composed specs +0.008s ... 0.008s

#7 did output specs +0s ... 0.008s

#8 start showIntegratedCPUs +0s ... 0.008s

#9 getting avg benchmarks for device 4922 +0.011s ... 0.02s

#10 got single benchmarks 4922 +0.044s ... 0.064s

#11 getting avg benchmarks for device 4622 +0.004s ... 0.068s

#12 got single benchmarks 4622 +0.006s ... 0.074s

#13 getting avg benchmarks for device 5949 +0.003s ... 0.078s

#14 got single benchmarks 5949 +0.004s ... 0.082s

#15 got avg benchmarks for devices +0s ... 0.082s

#16 No cached benchmark found, getting uncached values +0.01s ... 0.091s

#17 No cached benchmark found, getting uncached values +0s ... 0.092s

#18 min, max, avg, median took s +0.018s ... 0.11s

#19 before gaming benchmark output +0s ... 0.11s

#20 Got 730 rows for game benchmarks. +0.029s ... 0.139s

#21 composed SQL query for gamebenchmarks +0s ... 0.139s

#22 got data and put it in $dataArray +0.005s ... 0.144s

#23 benchmarks composed for output. +0.037s ... 0.181s

#24 calculated avg scores. +0s ... 0.181s

#25 return log +0.001s ... 0.182s

Teilen Sie diesen Artikel, um uns zu unterstützen. Jeder Link hilft!
Mail Logo
> Notebook Test, Laptop Test und News > Benchmarks / Technik > Benchmarks / Technik > Grafikkarten Vergleich - Head 2 Head
Autor: Klaus Hinum,  8.09.2017 (Update:  1.07.2023)