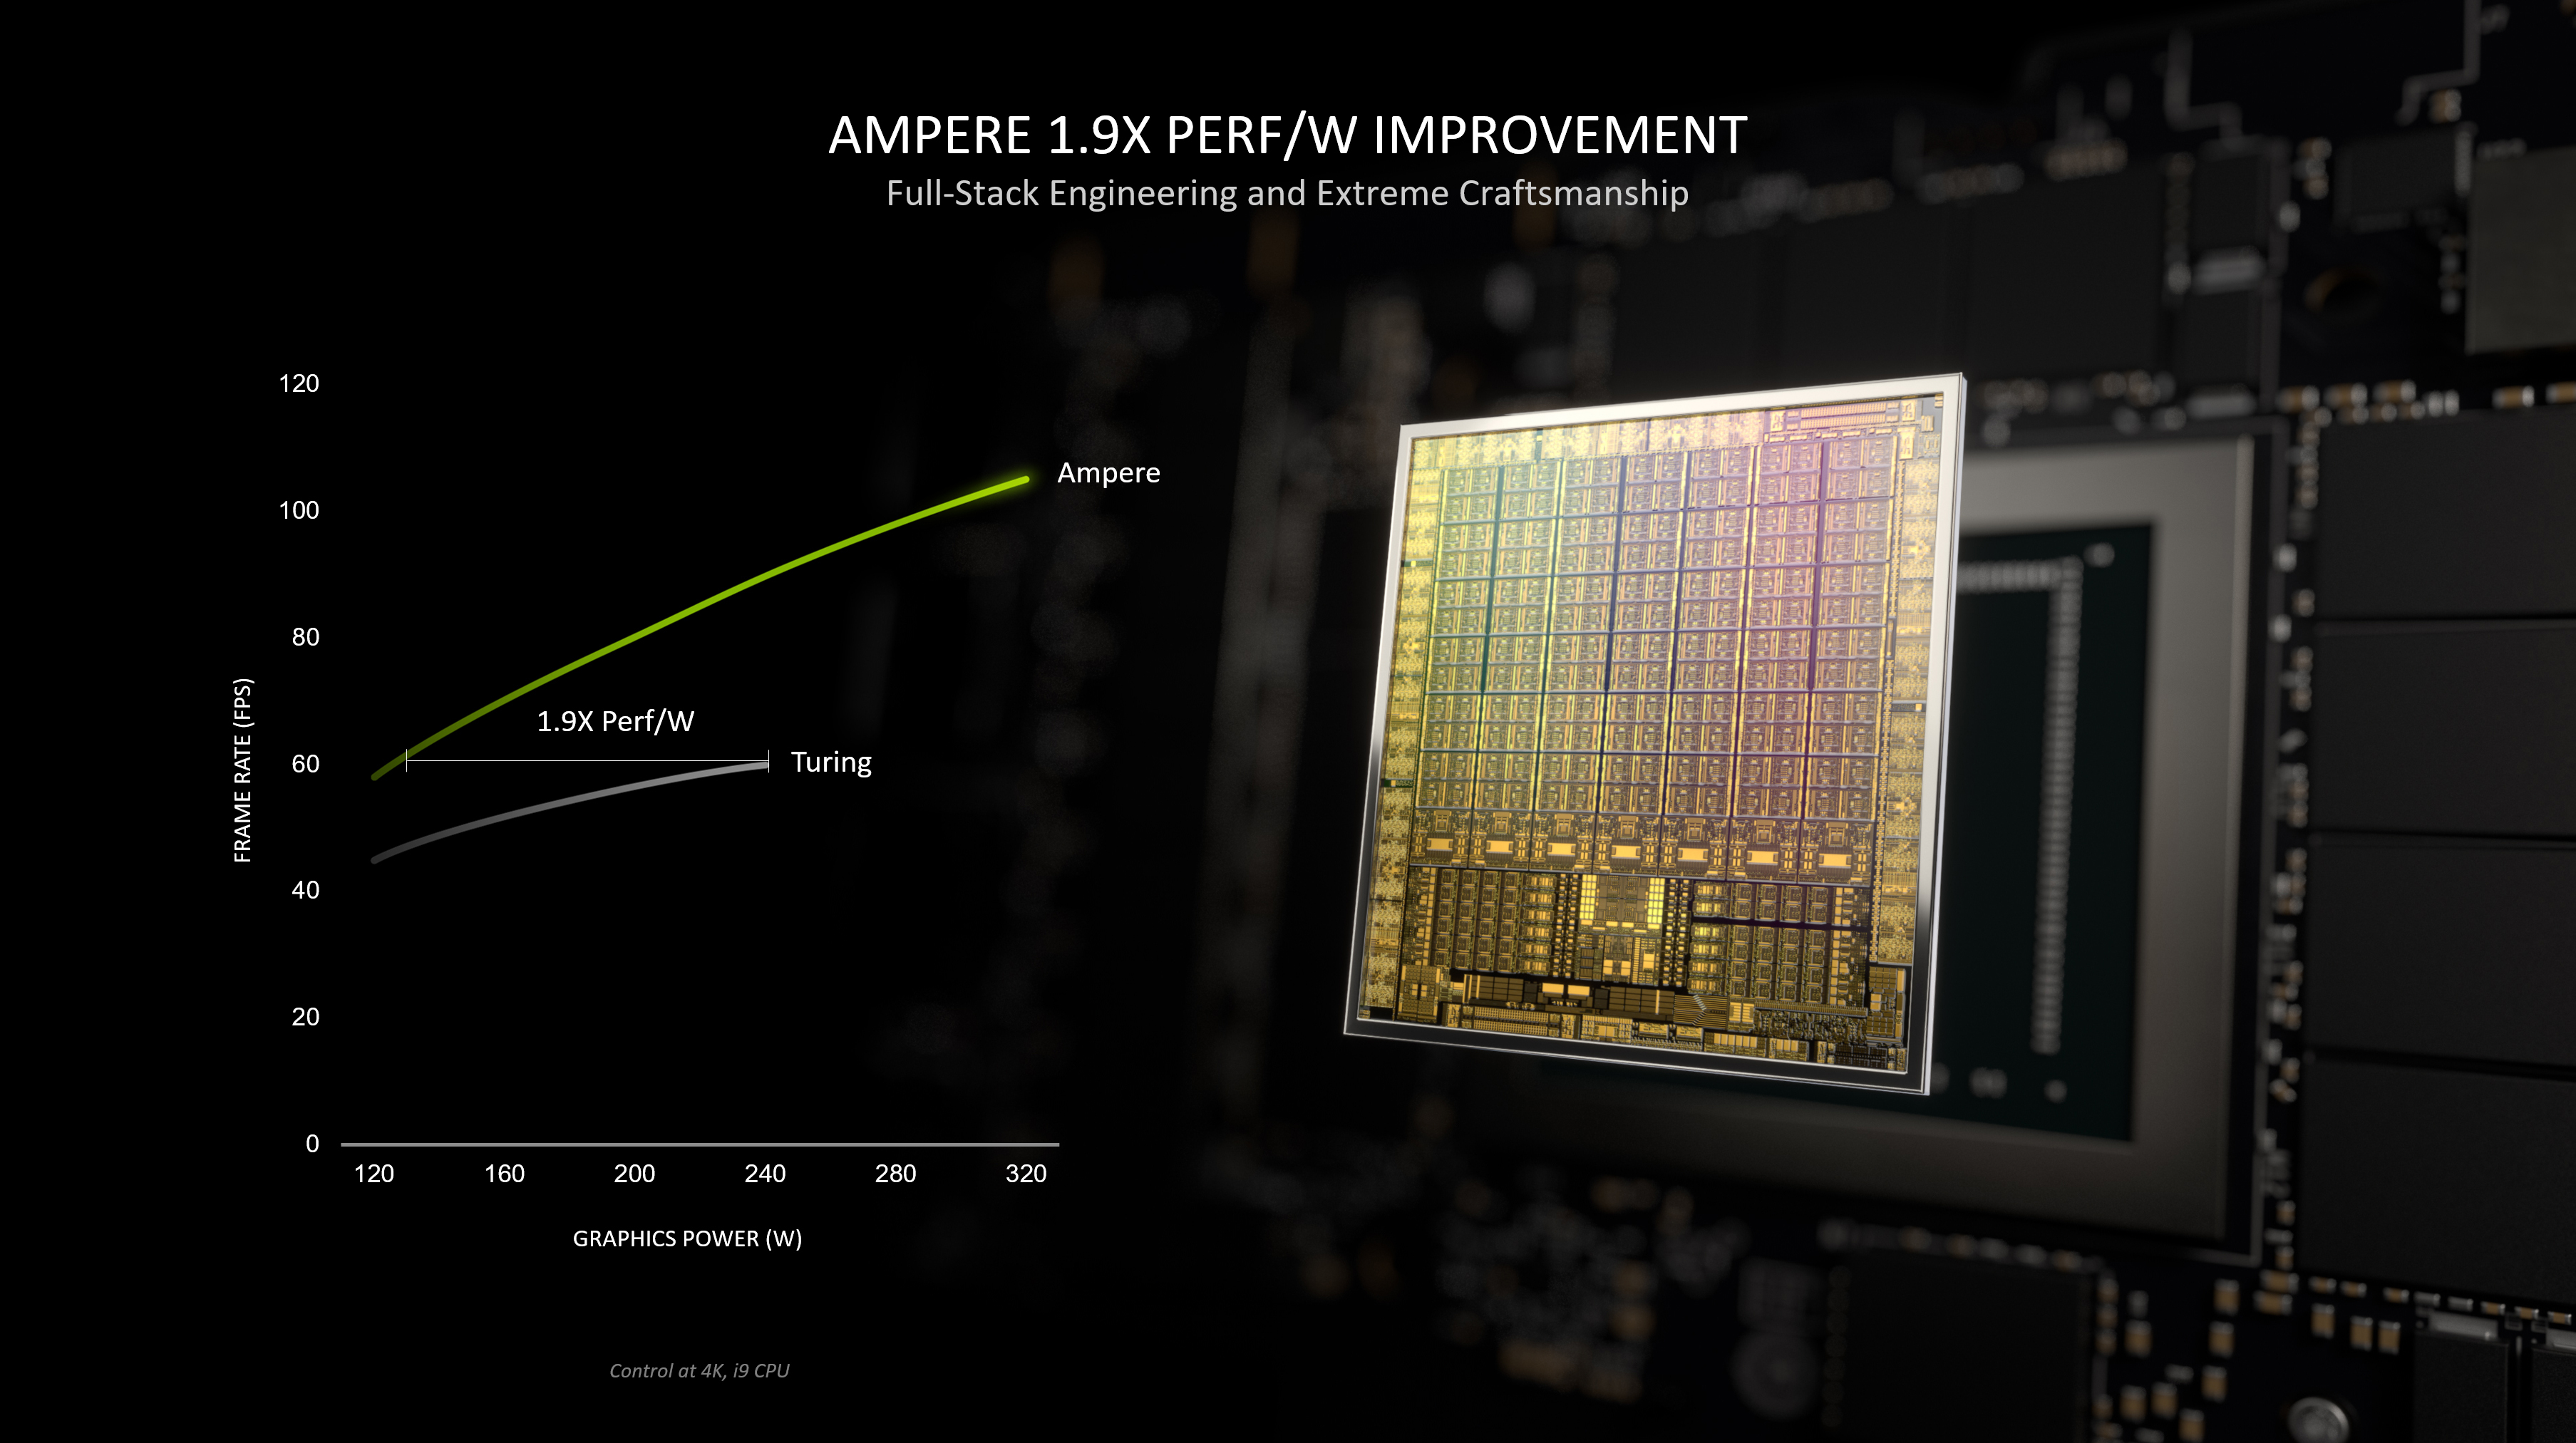
NVIDIA GeForce RTX 3070 Ti ► remove from comparison The Nvidia GeForce RTX 3070 Ti is a fast desktop GPU of the Ampere generation. It uses the GA104 chip with 6,144 cores and 8 GB GDDR6 dedicated graphics memory.
The performance in demanding games is ideal for QHD (2560x1440) and highest settings (e.g. A Plague Tale Requiem reaches 50fps in our benchmarks, see below).
The RTX3070Ti is rated at a TGP of 290 Watt.
NVIDIA GeForce RTX 3080 Max-Q NVIDIA GeForce RTX 3070 Ti GeForce RTX 3000 Series Codename GN20-E7 GA104 Ampere GA104 Architecture Ampere Ampere Pipelines 6144 - unified 6144 - unified Core Speed 780 - 1245 (Boost) MHz 1575 - 1770 (Boost) MHz Memory Speed 6000 MHz 19000 effective = 1188 MHz Memory Bus Width 256 Bit 256 Bit Memory Type GDDR6 GDDR6 Max. Amount of Memory 16 GB 8 GB Shared Memory no no API DirectX 12_2, Shader 6.7, OpenGL 4.6 DirectX 12_, Shader 6.7, OpenGL 4.6, OpenCL 3.0, Vulkan 1.3 Power Consumption 80 Watt 290 Watt technology 8 nm 8 nm Notebook Size large Date of Announcement 04.01.2021 31.05.2021 TMUs 192 ROPs 96 Raytracing Cores 48 Tensor / AI Cores 192 Cache L1: 128 KB, L2: 4 MB Memory Bandwidth 608.3 GB/s Transistors 17.4 Billion Die Size 392 mm² PCIe PCIe 4.0 x16 Displays 4 Displays (max.), HDMI 2.1, DisplayPort 1.4a
Performance Rating - 3DMark 11 + Fire Strike + Time Spy - GeForce RTX 3070 Ti
...
NVIDIA GeForce RTX 3070 Ti
max:
3DMark - 3DMark Speed Way Score
min: 3742 avg: 3773 median: 3748.5 (26%) max: 3852 Points
GPU TDP ? TDP 310 W 98% 100%
3DMark - 3DMark Steel Nomad
min: 3506 avg: 3603 median: 3531 (24%) max: 3771 Points
GPU TDP ? TDP 310 W 96% 100%
3DMark - 3DMark Steel Nomad Light
3DMark - 3DMark Solar Bay
3DMark - 3DMark Fire Strike Standard Score
min: 34036 avg: 35340 median: 35449 (54%) max: 36426 Points
GPU TDP ? TDP 310 W 98% 100%
3DMark - 3DMark Fire Strike Standard Graphics
min: 37472 avg: 37714 median: 37589.5 (35%) max: 38206 Points
GPU TDP ? TDP 310 W 99% 100%
3DMark - 3DMark Ice Storm Graphics
min: 624044 avg: 663135 median: 650084 (72%) max: 728328 Points
GPU TDP ? TDP 310 W 100% 90%
3DMark - 3DMark Time Spy Score
min: 15076 avg: 15313 median: 15206.5 (40%) max: 15762 Points
GPU TDP ? TDP 310 W 100% 99%
3DMark - 3DMark Time Spy Graphics
min: 14783 avg: 14931 median: 14947.5 (30%) max: 15045 Points
GPU TDP ? TDP 310 W 99% 100%
3DMark - 3DMark Ice Storm Unlimited Graphics
min: 699999 avg: 788388 median: 808594 (82%) max: 836363 Points
GPU TDP ? TDP 310 W 100% 90%
3DMark - 3DMark Ice Storm Extreme Graphics
min: 528021 avg: 581223 median: 587233 (69%) max: 622405 Points
GPU TDP ? TDP 310 W 100% 89%
3DMark - 3DMark Cloud Gate Score
min: 82735 avg: 84200 median: 83953.5 (79%) max: 86158 Points
GPU TDP ? TDP 310 W 99% 100%
3DMark - 3DMark Cloud Gate Graphics
min: 175918 avg: 198098 median: 203204 (50%) max: 210065 Points
GPU TDP ? TDP 310 W 94% 100%
3DMark - 3DMark Night Raid
min: 79464 avg: 82635 median: 80803 (76%) max: 89469 Points
GPU TDP ? TDP 310 W 100% 94%
3DMark - 3DMark Night Raid Graphics Score
min: 168217 avg: 170284 median: 170018 (65%) max: 172883 Points
GPU TDP ? TDP 310 W 99% 100%
3DMark 11 - 3DM11 Performance Score
min: 43271 avg: 44679 median: 44673.5 (54%) max: 46098 Points
GPU TDP ? TDP 310 W 97% 100%
3DMark 11 - 3DM11 Performance GPU
min: 49409 avg: 49759 median: 49588 (38%) max: 50450 Points
GPU TDP ? TDP 310 W 99% 100%
3DMark Vantage + NVIDIA GeForce RTX 3070 Ti 3DMark Vantage - 3DM Vant. Perf. total
min: 119487 avg: 121208 median: 120454 (35%) max: 124437 Points
GPU TDP ? TDP 310 W 98% 100%
3DM Vant. Perf. GPU no PhysX + NVIDIA GeForce RTX 3070 Ti 3DMark Vantage - 3DM Vant. Perf. GPU no PhysX
min: 122781 avg: 126569 median: 126438 (69%) max: 130621 Points
GPU TDP ? TDP 310 W 97% 100%
3DMark 05 - 3DMark 05 - Standard
min: 84337 avg: 85436 median: 85827 (94%) max: 86144 Points
GPU TDP ? TDP 310 W 100% 99%
3DMark 06 3DMark 06 - Standard 1280x1024 + NVIDIA GeForce RTX 3070 Ti 3DMark 06
min: 66399 avg: 69335 median: 67863.5 (89%) max: 75215 Points
GPU TDP ? TDP 310 W 100% 96%
Unigine Valley 1.0 - Unigine Valley 1.0 DX
min: 191.2 avg: 194.3 median: 194.5 (59%) max: 196.9 fps
GPU TDP ? TDP 310 W 100% 99%
Blender - Blender 3.3 Classroom CUDA *
GPU TDP ? TDP 310 W 100% 100%
Blender - Blender 3.3 Classroom OPTIX *
min: 19 avg: 19.5 median: 19.5 (7%) max: 20 Seconds
GPU TDP ? TDP 310 W 100% 100%
SPECviewperf 12 + NVIDIA GeForce RTX 3070 Ti SPECviewperf 12 - specvp12 sw-03
min: 83.7 avg: 95.6 median: 101 (25%) max: 102 fps
GPU TDP ? TDP 310 W 100% 92%
specvp12 snx-02 + NVIDIA GeForce RTX 3070 Ti SPECviewperf 12 - specvp12 snx-02
min: 14.7 avg: 15.1 median: 15.1 (2%) max: 15.6 fps
GPU TDP ? TDP 310 W 96% 100%
specvp12 showcase-01 + NVIDIA GeForce RTX 3070 Ti SPECviewperf 12 - specvp12 showcase-01
min: 180 avg: 188.7 median: 187 (33%) max: 199 fps
GPU TDP ? TDP 310 W 100% 92%
specvp12 mediacal-01 + NVIDIA GeForce RTX 3070 Ti SPECviewperf 12 - specvp12 mediacal-01
min: 106 avg: 108.3 median: 106 (27%) max: 113 fps
GPU TDP ? TDP 310 W 97% 100%
specvp12 maya-04 + NVIDIA GeForce RTX 3070 Ti SPECviewperf 12 - specvp12 maya-04
min: 274 avg: 278.7 median: 279 (76%) max: 283 fps
GPU TDP ? TDP 310 W 100% 100%
specvp12 energy-01 + NVIDIA GeForce RTX 3070 Ti SPECviewperf 12 - specvp12 energy-01
min: 17.6 avg: 17.9 median: 18 (16%) max: 18.1 fps
GPU TDP ? TDP 310 W 100% 99%
specvp12 creo-01 + NVIDIA GeForce RTX 3070 Ti SPECviewperf 12 - specvp12 creo-01
min: 71.3 avg: 72.2 median: 72.6 (29%) max: 72.8 fps
GPU TDP ? TDP 310 W 100% 99%
specvp12 catia-04 + NVIDIA GeForce RTX 3070 Ti SPECviewperf 12 - specvp12 catia-04
min: 136 avg: 137 median: 137 (23%) max: 138 fps
GPU TDP ? TDP 310 W 99% 100%
specvp12 3dsmax-05 + NVIDIA GeForce RTX 3070 Ti SPECviewperf 12 - specvp12 3dsmax-05
min: 321 avg: 327 median: 330 (50%) max: 330 fps
GPU TDP ? TDP 310 W 100% 99%
SPECviewperf 13 specvp13 sw-04 + NVIDIA GeForce RTX 3070 Ti SPECviewperf 13 - specvp13 sw-04
min: 128 avg: 140.3 median: 146 (39%) max: 147 fps
GPU TDP ? TDP 310 W 100% 94%
specvp13 snx-03 + NVIDIA GeForce RTX 3070 Ti SPECviewperf 13 - specvp13 snx-03
min: 26.4 avg: 27.4 median: 27.3 (3%) max: 28.6 fps
GPU TDP ? TDP 310 W 94% 100%
specvp13 showcase-02 + NVIDIA GeForce RTX 3070 Ti SPECviewperf 13 - specvp13 showcase-02
min: 184 avg: 190 median: 188 (32%) max: 198 fps
GPU TDP ? TDP 310 W 100% 94%
specvp13 medical-02 + NVIDIA GeForce RTX 3070 Ti SPECviewperf 13 - specvp13 medical-02
min: 76.6 avg: 81.6 median: 83.6 (14%) max: 84.6 fps
GPU TDP ? TDP 310 W 100% 96%
specvp13 maya-05 + NVIDIA GeForce RTX 3070 Ti SPECviewperf 13 - specvp13 maya-05
min: 434 avg: 436 median: 437 (50%) max: 437 fps
GPU TDP ? TDP 310 W 100% 100%
specvp13 energy-02 + NVIDIA GeForce RTX 3070 Ti SPECviewperf 13 - specvp13 energy-02
min: 29.9 avg: 30 median: 30 (10%) max: 30.2 fps
GPU TDP ? TDP 310 W 100% 100%
specvp13 creo-02 + NVIDIA GeForce RTX 3070 Ti SPECviewperf 13 - specvp13 creo-02
min: 286 avg: 287 median: 287 (42%) max: 288 fps
GPU TDP ? TDP 310 W 99% 100%
specvp13 catia-05 + NVIDIA GeForce RTX 3070 Ti SPECviewperf 13 - specvp13 catia-05
min: 200 avg: 201 median: 201 (22%) max: 202 fps
GPU TDP ? TDP 310 W 100% 100%
specvp13 3dsmax-06 + NVIDIA GeForce RTX 3070 Ti SPECviewperf 13 - specvp13 3dsmax-06
min: 320 avg: 326.7 median: 330 (52%) max: 330 fps
GPU TDP ? TDP 310 W 100% 98%
SPECviewperf 2020 specvp2020 snx-04 1080p + NVIDIA GeForce RTX 3070 Ti SPECviewperf 2020 - specvp2020 snx-04 1080p
specvp2020 medical-03 1080p + NVIDIA GeForce RTX 3070 Ti SPECviewperf 2020 - specvp2020 medical-03 1080p
specvp2020 maya-06 1080p + NVIDIA GeForce RTX 3070 Ti SPECviewperf 2020 - specvp2020 maya-06 1080p
specvp2020 energy-03 1080p + NVIDIA GeForce RTX 3070 Ti SPECviewperf 2020 - specvp2020 energy-03 1080p
specvp2020 creo-03 1080p + NVIDIA GeForce RTX 3070 Ti SPECviewperf 2020 - specvp2020 creo-03 1080p
specvp2020 catia-06 1080p + NVIDIA GeForce RTX 3070 Ti SPECviewperf 2020 - specvp2020 catia-06 1080p
specvp2020 3dsmax-07 1080p + NVIDIA GeForce RTX 3070 Ti SPECviewperf 2020 - specvp2020 3dsmax-07 1080p
specvp2020 snx-04 4k + NVIDIA GeForce RTX 3070 Ti SPECviewperf 2020 - specvp2020 snx-04 4k
min: 22.2 avg: 22.7 median: 22.5 (2%) max: 23.3 fps
GPU TDP ? TDP 310 W 97% 100%
specvp2020 medical-03 4k + NVIDIA GeForce RTX 3070 Ti SPECviewperf 2020 - specvp2020 medical-03 4k
min: 15.3 avg: 16 median: 16.3 (10%) max: 16.5 fps
GPU TDP ? TDP 310 W 100% 98%
specvp2020 maya-06 4k + NVIDIA GeForce RTX 3070 Ti SPECviewperf 2020 - specvp2020 maya-06 4k
min: 289 avg: 290.3 median: 290 (42%) max: 292 fps
GPU TDP ? TDP 310 W 100% 100%
specvp2020 energy-03 4k + NVIDIA GeForce RTX 3070 Ti SPECviewperf 2020 - specvp2020 energy-03 4k
min: 39.1 avg: 48.6 median: 39.6 (6%) max: 67 fps
GPU TDP ? TDP 310 W 73% 100%
specvp2020 creo-03 4k + NVIDIA GeForce RTX 3070 Ti SPECviewperf 2020 - specvp2020 creo-03 4k
min: 99.2 avg: 99.3 median: 99.3 (45%) max: 99.5 fps
GPU TDP ? TDP 310 W 100% 100%
specvp2020 catia-06 4k + NVIDIA GeForce RTX 3070 Ti SPECviewperf 2020 - specvp2020 catia-06 4k
min: 48 avg: 48.3 median: 48.3 (32%) max: 48.6 fps
GPU TDP ? TDP 310 W 99% 100%
specvp2020 3dsmax-07 4k + NVIDIA GeForce RTX 3070 Ti SPECviewperf 2020 - specvp2020 3dsmax-07 4k
min: 93.4 avg: 97.3 median: 99 (33%) max: 99.5 fps
GPU TDP ? TDP 310 W 100% 97%
Basemark GPU 1.2 - Basemark GPU 1.2 Vulkan Official Medium Offscreen 1080
Basemark GPU 1.2 - Basemark GPU 1.2 Vulkan Official High Offscreen 2160
Geekbench 6.5 - Geekbench 6.5 GPU OpenCL
Geekbench 6.5 - Geekbench 6.5 GPU Vulkan
LuxMark v2.0 64Bit - LuxMark v2.0 Room GPU
min: 4365 avg: 4446 median: 4481 (16%) max: 4492 Samples/s
GPU TDP ? TDP 310 W 100% 99%
LuxMark v2.0 64Bit - LuxMark v2.0 Sala GPU
min: 11083 avg: 11102 median: 11096 (19%) max: 11126 Samples/s
GPU TDP ? TDP 310 W 100% 100%
ComputeMark v2.1 - ComputeMark v2.1 Result
min: 3273 avg: 26440 median: 34073.5 (28%) max: 34339 Points
GPU TDP ? TDP 310 W 54% 100%
Power Consumption - Furmark Stress Test Power Consumption - external Monitor *
min: 437 avg: 461.7 median: 472 (64%) max: 476 Watt
GPU TDP ? TDP 310 W 100% 114%
Power Consumption - The Witcher 3 Power Consumption - external Monitor *
Power Consumption - Power Efficiency - Witcher 3 ultra external Monitor
Power Consumption - Cyberpunk 2077 Power Consumption - external Monitor *
min: 464 avg: 515 median: 515 (65%) max: 566 Watt
GPU TDP ? TDP 310 W 100% 146%
Power Consumption - Power Efficiency - Cyberpunk 2077 ultra
Average Benchmarks NVIDIA GeForce RTX 3070 Ti → 0% n=0
- Range of benchmark values for this graphics card
- Average benchmark values for this graphics card
* Smaller numbers mean a higher performance
1 This benchmark is not used for the average calculation
The following benchmarks stem from our benchmarks of review laptops. The performance depends on the used graphics memory, clock rate, processor, system settings, drivers, and operating systems. So the results don't have to be representative for all laptops with this GPU. For detailed information on the benchmark results, click on the fps number.
NVIDIA GeForce RTX 3080 Max-Q NVIDIA GeForce RTX 3070 Ti low med. high ultra QHD 4K low med. high ultra QHD 4K F1 25 373 303 227 22.1 12.3 5.3 Doom: The Dark Ages 93.1 83.4 74.2 73.4 47.4 10.8 The Elder Scrolls IV Oblivion Remastered 156.7 104.7 70.2 35.9 22.7 Assassin's Creed Shadows 68 59 49 34 30 Civilization 7 329 258 191.6 131.2 56.5 Monster Hunter Wilds 88.8 73.8 44.6 31.4 14.2 Kingdom Come Deliverance 2 176 136.6 111.5 79 58.4 33 Indiana Jones and the Great Circle 139 48 87.1 67.3 Stalker 2 91 79 69 58 28 3.5 Call of Duty Black Ops 6 169 153 108 104 79 50 Until Dawn 178 131 90 66 47 27 God of War Ragnarök 192 159 141 131 100 58 Final Fantasy XVI 100 99 85 78 55 30 Space Marine 2 134 118 114 102 74 35 Star Wars Outlaws 69 65 55 46 34 17 Black Myth: Wukong 112 85 65 37 28 14 Once Human 279 200 166 159 103 54 The First Descendant 214 143 114 98 66 37 F1 24 430 368 277 92 60 28 Senua's Saga Hellblade 2 87.8 73.3 53.6 38.8 17.1 Ghost of Tsushima 140.1 120.6 109.9 86.9 48.9 27.4 Horizon Forbidden West 158.3 134.9 97 86.7 68.5 29.1 Alone in the Dark 271 264 226 159.6 99.4 26 Dragon's Dogma 2 106.8 97.3 76.9 47.4 Last Epoch 295 293 281 232 156.3 79.6 Skull & Bones 153 140 112 87 72 45 Helldivers 2 208 156.5 137.5 134.1 97.7 45.9 Enshrouded 105.2 91.4 78.3 59.6 41.8 23.9 Palworld 239 219 143.4 132.4 96.5 54.3 Prince of Persia The Lost Crown 359 359 359 359 267 Ready or Not 297 293 263 201 124.7 58.7 The Finals 346 271 238 184.8 118.7 57.8 Avatar Frontiers of Pandora 112 104 90 69 47 25 Call of Duty Modern Warfare 3 2023 172 154 121 114 81 50 EA Sports WRC 191.4 146.5 134.9 126.3 93.8 52.2 Alan Wake 2 86.7 72.5 66.7 49.5 29.4 Lords of the Fallen 129.2 108.9 83.2 57.2 40 20.7 Total War Pharaoh 508.5 321.8 202.4 163.5 119.4 62.9 Assassin's Creed Mirage 159 148 141 114 90 57 EA Sports FC 24 358 318 262 246 190 116.6 Counter-Strike 2 350 337 292 240 159.5 94.2 Cyberpunk 2077 2.2 Phantom Liberty 192 152 131 114 72 32 Baldur's Gate 3 196 155 136 134 96 52 Lies of P 263 230 201 180.9 124.3 65.2 Starfield 86.4 74.9 61.7 56.3 46.7 31.8 Armored Core 6 119.6 119.6 119.6 119.3 109.8 66.2 Immortals of Aveum 85.3 72.6 60 41.9 23.2 Atlas Fallen 183.2 190.4 195.7 159.7 110.9 60.8 Ratchet & Clank Rift Apart 132.6 115 93.7 83.7 69.1 45.7 F1 23 450 399 284 92.4 59.3 28.8 Diablo 4 385 340 299 252 158.8 89.1 Star Wars Jedi Survivor 123.7 109.1 96.4 100.5 61.1 30.3 Dead Island 2 351 332 250 191 133.6 67.9 The Last of Us 148.8 121.9 108.3 90.1 57 25 Resident Evil 4 Remake 219 155.7 143.7 105 79.2 47.2 The Callisto Protocol 195 159 104 103 78 46.7 Need for Speed Unbound 187.9 176.6 153.8 129.8 98.7 55.8 Spider-Man Miles Morales 175.9 162.5 151.3 143.3 110.7 58.3 Call of Duty Modern Warfare 2 2022 151 143 115 113 81 50 Uncharted Legacy of Thieves Collection 106.2 104.4 100.4 96.4 77.4 38.5 A Plague Tale Requiem 167.1 129.1 95.8 75.5 52.8 30.5 FIFA 23 318 272 226 224 193.5 116.1 The Quarry 234 174.3 143.5 115.6 81.1 44.4 F1 22 409 396 298 97 62 30 Tiny Tina's Wonderlands 315 249 169 131 93 51 Cyberpunk 2077 1.6 178 141 124 113 73 35 GRID Legends 288 257 226 179 161 98 God of War 194.9 163.8 132.9 94.2 81 56.4 Forza Horizon 5 303 210 196 121 102 70 Far Cry 6 219 184 162 146 112 17 F1 2021 649 486 379 183.9 135 76.7 Watch Dogs Legion 218 193 166 108 81 46 F1 2020 556 427 352 243 183.8 104.8 Borderlands 3 239 210 165 132 96 53 Far Cry New Dawn 197 173 166 148 135 84 Metro Exodus 298 185 141 111 89 56 Assassin´s Creed Odyssey 230 171 147 103 93 58 Shadow of the Tomb Raider 330 231 209 192 134 73 Strange Brigade 703 398 316 274 205 119 Far Cry 5 243 205 196 183 150 82 X-Plane 11.11 218 200 163 132 Final Fantasy XV Benchmark 235 206 151 113 67 Assassin´s Creed Origins 253 173 161 143 117 77 Dota 2 Reborn 316 289 276 256 199 The Witcher 3 705 469 294 144 113.3 109 GTA V 188 187.9 186.9 159.1 137.3 147.3 NVIDIA GeForce RTX 3080 Max-Q NVIDIA GeForce RTX 3070 Ti low med. high ultra QHD 4K low med. high ultra QHD 4K < 30 fps < 60 fps < 120 fps ≥ 120 fps < 30 fps < 60 fps < 120 fps ≥ 120 fps 16 69 1 18 64 4 28 53 1 9 34 36 4 18 44 18 20 38 21 4
log 13. 03:52:28
#0 ran 0s before starting gpusingle class +0s ... 0s
#1 checking url part for id 10586 +0s ... 0s
#2 checking url part for id 11450 +0s ... 0s
#3 not redirecting to Ajax server +0s ... 0s
#4 did not recreate cache, as it is less than 5 days old! Created at Sun, 12 Oct 2025 11:12:41 +0200 +0s ... 0s
#5 composed specs +0.002s ... 0.002s
#6 did output specs +0s ... 0.002s
#7 start showIntegratedCPUs +0s ... 0.002s
#8 getting avg benchmarks for device 10586 +0s ... 0.003s
#9 got single benchmarks 10586 +0s ... 0.003s
#10 getting avg benchmarks for device 11450 +0.004s ... 0.006s
#11 got single benchmarks 11450 +0.001s ... 0.007s
#12 got avg benchmarks for devices +0s ... 0.007s
#13 min, max, avg, median took s +0.018s ... 0.025s
#14 before gaming benchmark output +0s ... 0.025s
#15 Got 756 rows for game benchmarks. +0.012s ... 0.037s
#16 composed SQL query for gamebenchmarks +0s ... 0.037s
#17 got data and put it in $dataArray +0.005s ... 0.042s
#18 benchmarks composed for output. +0.031s ... 0.073s
#19 calculated avg scores. +0s ... 0.073s
#20 return log +0.001s ... 0.074s