Notebookcheck Logo

MediaTek Dimensity 9300+ vs MediaTek Dimensity 9300

MediaTek Dimensity 9300+

► remove from comparison Mediatek Dimensity 9300+

The MediaTek Dimensity 9300+ (9300 Plus) is a high-end SoC for smartphones and tablets based on Android. For the first time, the CPU no longer uses classic energy-saving cores, but only so-called big cores. The CPU part integrates a fast ARM Cortex-X4 core with up to 3.4 GHz, three lower clocked X4 cores with up to 2.9 GHz and four smaller Cortex-A520 cores with up to 2 GHz. The fast prime core is also the difference to the identical Dimensity 9300. As with the latter, the SoC offers a large 18 MB level 3 cache.

As expected, the performance in initial benchmarks with a Xiaomi 14T Pro is slightly faster than the Dimensity 9300 and comparable to a Snapdragon 8 Gen 3 (in Geekbench 6). In PCMark and Crossmark, the performance is slightly worse and more at the level of a Qualcomm Snapdragon 8 Gen 2.

The integrated MediaTek APU 790 fully relies on Generative AI and aims to accelerate adapted algorithms by a factor of eight. Energy efficiency is said to have been improved by 45 percent. With the MiraVision 990, displays can be operated in Ultra HD at up to 120 Hz and Google Ultra HDR image display (from Android 14) is also supported.

The graphics unit is an ARM Immortalis-G720 MP12 is used.

The SoC is manufactured using the 3rd generation 4-nanometer process at TSMC (N4X).

MediaTek Dimensity 9300

► remove from comparison Mediatek Dimensity 9300
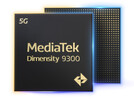
The MediaTek Dimensity 9300 (MT6989) is a high-end SoC for smartphones and tablets based on Android. For the first time, the CPU no longer uses classic energy-saving cores, but only so-called big cores. In this case, four Cortex-X4 cores with up to 3.25 GHz each and four additional Cortex-A720 cores with up to 2.0 GHz each. The manufacturer has also increased the level 3 and SLC cache by 29% compared to its predecessor, which now has a capacity of 18 MB.

In initial benchmarks with a Vivo X100 Pro, the performance is roughly comparable to an Apple A15 or a Qualcomm Snapdragon 8 Gen 2.

The integrated MediaTek APU 790 fully relies on generative AI and aims to accelerate adapted algorithms by a factor of eight. Energy efficiency is said to have been improved by 45 percent. With the MiraVision 990, displays can be operated in Ultra HD at up to 120 Hz and Google Ultra HDR image display (from Android 14) is also supported.

The graphics unit is an ARM Immortalis-G720 MP12 is used.

The SoC is manufactured using the 3rd generation 4-nanometer process at TSMC (N4X).

ModelMediaTek Dimensity 9300+MediaTek Dimensity 9300
CodenameCortex-X4 / A720Cortex-X4 / A720
SeriesMediatek Dimensity 9000Mediatek Dimensity 9000
Series: Dimensity 9000 Cortex-X4 / A720
MediaTek Dimensity 9300+ « 2 - 3.4 GHz8 / 8 cores18 MB L3 Cortex-X4 / A720
MediaTek Dimensity 93002 - 3.25 GHz8 / 8 cores18 MB L3 Cortex-X4 / A720
MediaTek Dimensity 9300+2 - 3.4 GHz8 / 8 cores18 MB L3 Cortex-X4 / A720
MediaTek Dimensity 9300 « 2 - 3.25 GHz8 / 8 cores18 MB L3 Cortex-X4 / A720
Clock2000 - 3400 MHz2000 - 3250 MHz
L3 Cache18 MB18 MB
Cores / Threads8 / 8
1 x 3.4 GHz ARM Cortex-X4
3 x 2.9 GHz ARM Cortex-X4
4 x 2.0 GHz ARM Cortex-A720
8 / 8
4 x 3.3 GHz ARM Cortex-X4
4 x 2.0 GHz ARM Cortex-A720
Technology4 nm4 nm
FeaturesARM Immortalis-G720 MP12, Wi-Fi 7 up to 6.5 GBit/s, Bluetooth 5.4, LPDDR5T-9600 @ 4800 MHz, Imagiq 990, AI 5G Modem up to 7 GBit/s,ARM Immortalis-G720 MP12, Wi-Fi 7 up to 6.5 GBit/s, Bluetooth 5.4, LPDDR5T-9600 @ 4800 MHz, Imagiq 990, AI 5G Modem up to 7 GBit/s,
ArchitectureARMARM
Announced
Manufacturerwww.mediatek.comwww.mediatek.com

Benchmarks

3DMark - 3DMark Sling Shot Extreme (ES 3.1) Unlimited Physics
min: 7393     avg: 7609     median: 7451 (70%)     max: 7982 Points
7922 Points (75%)
3DMark - 3DMark Sling Shot (ES 3.0) Unlimited Physics
8749 Points (100%)
Geekbench 6.5 - Geekbench 6.5 Single-Core
min: 2167     avg: 2195     median: 2189.5 (55%)     max: 2234 Points
2207 Points (55%)
Geekbench 6.5 - Geekbench 6.5 Multi-Core
min: 6972     avg: 7148     median: 7146 (28%)     max: 7327 Points
7408 Points (29%)
Geekbench 5.5 - Geekbench 5.1 - 5.5 64 Bit Single-Core
min: 1598     avg: 1623     median: 1632 (62%)     max: 1639 Points
1604 Points (61%)
Geekbench 5.5 - Geekbench 5.1 - 5.5 64 Bit Multi-Core
min: 6478     avg: 6744     median: 6678 (12%)     max: 7077 Points
6681 Points (12%)
Geekbench 4.4 - Geekbench 4.1 - 4.4 64 Bit Single-Core
min: 9443     avg: 9448     median: 9448 (94%)     max: 9453 Points
8787 Points (88%)
Geekbench 4.4 - Geekbench 4.1 - 4.4 64 Bit Multi-Core
min: 30323     avg: 30653     median: 30653 (30%)     max: 30983 Points
26990 Points (26%)
Mozilla Kraken 1.1 - Kraken 1.1 Total Score *
min: 591.54     avg: 997     median: 635.9 (1%)     max: 2123.5 ms
698 ms (1%)
Sunspider - Sunspider 1.0 Total Score *
190.9 ms (2%)
Octane V2 - Octane V2 Total Score
min: 25646     avg: 53467     median: 58584.5 (43%)     max: 71054 Points
66656 Points (49%)
WebXPRT 4 - WebXPRT 4 Score
min: 78     avg: 162.5     median: 189.5 (52%)     max: 193 Points
183 Points (50%)
WebXPRT 3 - WebXPRT 3 Score
199 Points (36%)
Antutu v9 - AnTuTu v9 Total Score
1484500 Points (72%)
Antutu v9 - AnTuTu v9 CPU
317463 Points (79%)
Antutu v10 - AnTuTu v10 Total Score
min: 1404870     avg: 1813270     median: 1879900 (62%)     max: 2088410 Points
2038810 Points (68%)
Antutu v10 - AnTuTu v10 CPU
min: 277635     avg: 431749     median: 474330 (14%)     max: 500701 Points
479443 Points (14%)
PCMark for Android - PCM f. Android Storage 2.0 random write internal
min: 37.1     avg: 100.6     median: 127.2 (87%)     max: 137.6 MB/s
136.2 MB/s (93%)
PCMark for Android - PCM f. Android Storage 2.0 seq write internal
min: 1487     avg: 1911     median: 1649 (46%)     max: 2596 MB/s
3236 MB/s (91%)
PCMark for Android - PCM f. Android Storage 2.0 random read internal
min: 39.6     avg: 56.3     median: 55.2 (27%)     max: 74 MB/s
67.7 MB/s (33%)
PCMark for Android - PCM f. Android Storage 2.0 seq read internal
min: 1504     avg: 1758     median: 1752 (44%)     max: 2019 MB/s
1747 MB/s (43%)
PCMark for Android - PCM f. Android Storage 2.0 score
min: 16494     avg: 32269     median: 30758 (13%)     max: 49556 Points
46550 Points (20%)
PCMark for Android - PCM f. Android Work Score 3.0
min: 14377     avg: 15964     median: 16368.5 (60%)     max: 16743 Points
14573 Points (53%)
CrossMark - CrossMark Overall
min: 956     avg: 1222     median: 1342 (50%)     max: 1367 Points
1301 Points (49%)
Power Consumption - Geekbench 5.5 Power Consumption 150cd *
min: 5.65     avg: 8.7     median: 9 (4%)     max: 11.2 Watt
6.2 Watt (3%)
Power Consumption - Idle Power Consumption 150cd 1min *
min: 0.699     avg: 2.4     median: 2.4 (3%)     max: 4.16 Watt
0.6 Watt (1%)

Average Benchmarks MediaTek Dimensity 9300+ → 100% n=19

Average Benchmarks MediaTek Dimensity 9300 → 109% n=19

- Range of benchmark values for this graphics card
red legend - Average benchmark values for this graphics card
* Smaller numbers mean a higher performance
1 This benchmark is not used for the average calculation

Add one or more devices and compare

In the following list you can select (and also search for) devices that should be added to the comparison. You can select more than one device.

restrict list:
v1.33
log 30. 20:36:02

#0 ran 0s before starting gpusingle class +0s ... 0s

#1 checking url part for id 18426 +0s ... 0s

#2 checking url part for id 17401 +0s ... 0s

#3 not redirecting to Ajax server +0s ... 0s

#4 did not recreate cache, as it is less than 5 days old! Created at Mon, 29 Sep 2025 12:06:34 +0200 +0s ... 0s

#5 composed specs +0.005s ... 0.005s

#6 did output specs +0s ... 0.005s

#7 getting avg benchmarks for device 18426 +0.001s ... 0.005s

#8 got single benchmarks 18426 +0.007s ... 0.012s

#9 getting avg benchmarks for device 17401 +0.001s ... 0.013s

#10 got single benchmarks 17401 +0.004s ... 0.017s

#11 got avg benchmarks for devices +0s ... 0.017s

#12 min, max, avg, median took s +0.019s ... 0.035s

#13 return log +0s ... 0.036s

Please share our article, every link counts!
Mail Logo
> Expert Reviews and News on Laptops, Smartphones and Tech Innovations > Benchmarks / Tech > Processor Comparison - Head 2 Head
Redaktion, 2017-09- 8 (Update: 2023-07- 1)