Notebookcheck Logo

Intel Core 5 120U vs Intel Core 7 150U

Intel Core 5 120U

► remove from comparison Intel Core 5 120U

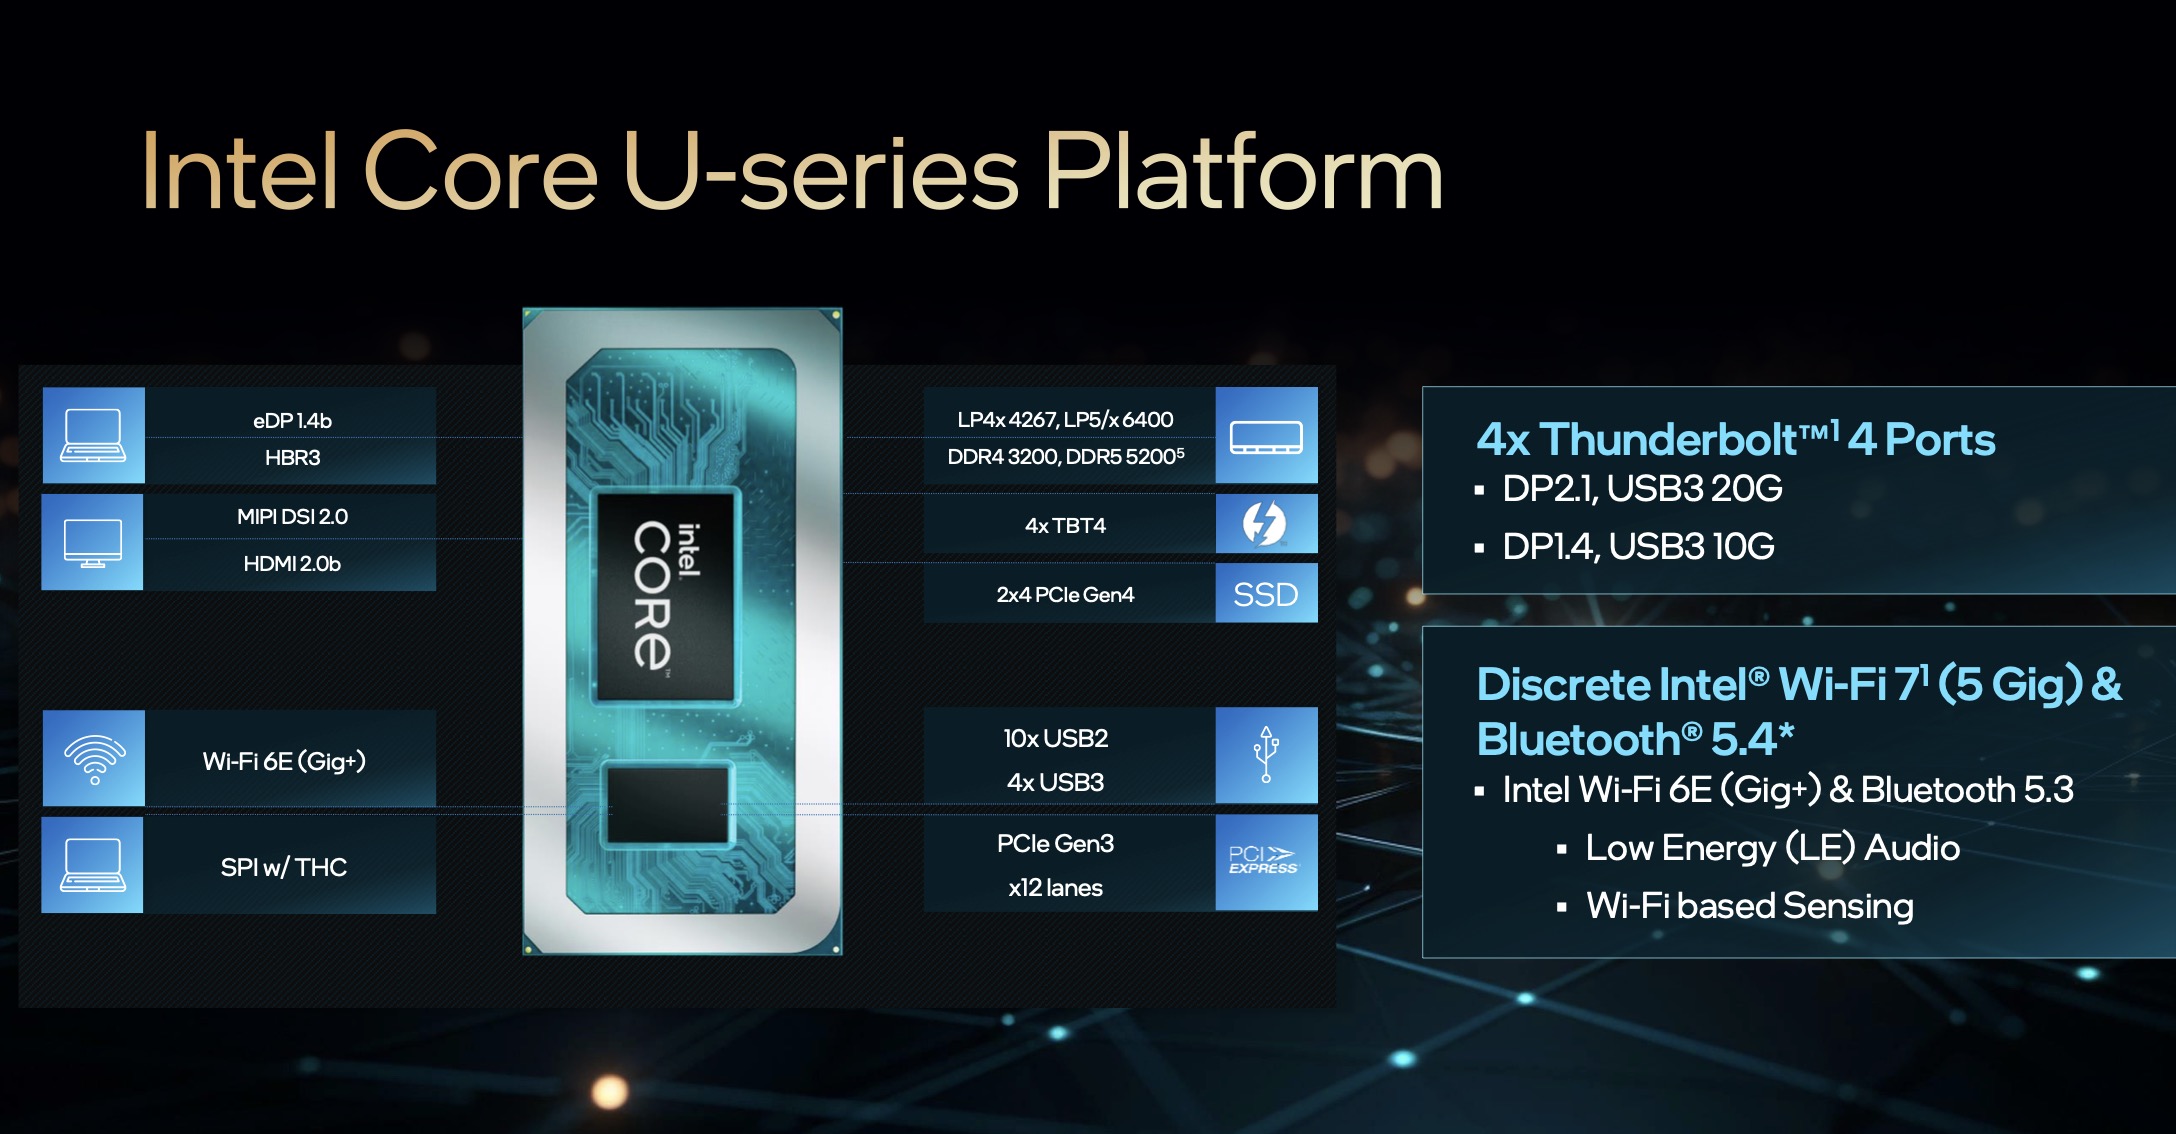
The Intel Core 5 120U is a mid-range notebook CPU based on the Raptor Lake-U Refresh (RPL-U) series (Alder Lake architecture), which was introduced in January 2024. The CPU offers 2 performance cores (P-cores, Golden Cove architecture) and 8 efficiency cores (E-cores, Gracemont architecture). The P-cores support hyperthreading (therefore 12 threads together) and clock from 1.4 to 5 GHz. The E-cores clock from 0.9 - 3.8 GHz and should offer comparable performance to old Skylake cores (e.g. i7-6300HQ). The C5 120U also supports vPro Essentials management features.

Performance

Due to the high clock rates, the performance is comparable to the old Core i7-1355U. As usual with Alder Lake, the performance is heavily dependent on the cooling and the TDP settings.

Graphics unit

Like its predecessor, Intel integrates an Intel Xe-based graphics unit in Alder Lake. 80 of the 96 EUs are activated on the 120U.

Features

Like Tiger Lake, Alder-Lake-P also has WiFi 6E and Thunderbolt 4 (4x) partially integrated. The integrated memory controller supports LPDDR5-6400 and the integrated Gaussian and Neural Accelerator (GNA) is installed in version 3.0. The Quick Sync 8 media engine is the same as in Rocket Lake and supports MPEG-2, AVC, VC-1 decode, JPEG, VP8 decode, VP9, HEVC and AV1 decode. The chip still only supports PCIe 4.0 (x8 for GPU and two x4 for SSDs).

Power consumption

The Intel Core 5 120U is specified with 15 watts (PL1) TDP and 55 watts (PL2) max. turbo power. The processor is manufactured using the further improved Intel 7 process (10 nm SuperFin).

Intel Core 7 150U

► remove from comparison Intel Core 7 150U

The Intel Core 7 150U is a high-end notebook CPU based on the Raptor Lake-U Refresh (RPL-U) series (Alder Lake architecture), which was introduced in January 2024. The CPU offers 2 performance cores (P-cores, Golden Cove architecture) and 8 efficiency cores (E-cores, Gracemont architecture). The P-cores support hyperthreading (therefore 12 threads together) and clock from 1.8 to 5.4 GHz. The E-cores clock from 1.2 - 4 GHz and should offer comparable performance to old Skylake cores (e.g. i7-6300HQ). The Core 7 150U also supports vPro Essentials management features.

Performance

Due to the similar clock rates, the performance is slightly above the old Core i7-1365U. As usual with Alder Lake, the performance is heavily dependent on the cooling and the TDP settings.

Graphics unit

Like its predecessor, Intel integrates an Intel Xe-based graphics unit called Intel Graphics in Alder Lake. All 96 EUs are probably activated on the 150U.

Features

Like Tiger Lake, Alder-Lake-P also has WiFi 6E and Thunderbolt 4 (4x) partially integrated. The integrated memory controller supports LPDDR5-6400 and the integrated Gaussian and Neural Accelerator (GNA) is installed in version 3.0. The Quick Sync 8 media engine is the same as in Rocket Lake and supports MPEG-2, AVC, VC-1 decode, JPEG, VP8 decode, VP9, HEVC and AV1 decode. The chip supports PCIe 5.0 x8 for a dGPU and two PCIe 4.0 x4 for SSDs. The PCH also offers PCIe Gen3 x12.

Power consumption

The Intel Core 7 150U is specified with 15 watts (PL1) TDP and 55 watts (PL2) max. turbo power. The processor is manufactured using the further improved Intel 7 process (10 nm SuperFin).

ModelIntel Core 5 120UIntel Core 7 150U
CodenameRaptor Lake-U RefreshRaptor Lake-U Refresh
SeriesIntel Raptor Lake-UIntel Raptor Lake-U
Series: Raptor Lake-U Raptor Lake-U Refresh
Intel Core 7 150U1.2 - 5.4 GHz10 / 12 cores12 MB L3
Intel Core 5 120U « 0.9 - 5 GHz10 / 12 cores12 MB L3
Intel Core 3 100U compare0.9 - 4.7 GHz6 / 8 cores10 MB L3
Intel Core 7 150U « 1.2 - 5.4 GHz10 / 12 cores12 MB L3
Intel Core 5 120U0.9 - 5 GHz10 / 12 cores12 MB L3
Intel Core 3 100U compare0.9 - 4.7 GHz6 / 8 cores10 MB L3
Clock900 - 5000 MHz1200 - 5400 MHz
L1 Cache928 KB928 KB
L2 Cache9.5 MB9.5 MB
L3 Cache12 MB12 MB
Cores / Threads10 / 12
2 x 5.0 GHz Intel Golden Cove P-Core
8 x 3.8 GHz Intel Gracemont E-Core
10 / 12
2 x 5.4 GHz Intel Golden Cove P-Core
8 x 4.0 GHz Intel Gracemont E-Core
TDP15 Watt15 Watt
TDP Turbo PL255 Watt55 Watt
Technology10 nm10 nm
max. Temp.100 °C100 °C
SocketBGA1700BGA1700
FeaturesThread DirectorThread Director
iGPUIntel Iris Xe Graphics G7 80EUs ( - 1250 MHz)Intel Iris Xe Graphics G7 96EUs ( - 1300 MHz)
Architecturex86x86
Announced
Manufacturerark.intel.comark.intel.com

Benchmarks

Performance Rating - CB R15 + R20 + 7-Zip + X265 + Blender + 3DM11 CPU - Core 5 120U
37.1 pt (62%)
Restrict / Search: Model: Max. age: years
Performance Rating - CB R15 + R20 + 7-Zip + X265 + Blender + 3DM11 CPU - Core 7 150U
37.1 pt (62%)
Restrict / Search: Model: Max. age: years
Cinebench 2024 - Cinebench 2024 CPU Single Core
108.5 Points (61%)
Cinebench 2024 - Cinebench 2024 CPU Multi Core
421 Points (8%)
min: 432     avg: 470     median: 470 (9%)     max: 508 Points
Cinebench R23 - Cinebench R23 Multi Core
7862 Points (7%)
min: 7226     avg: 8722     median: 8883 (8%)     max: 9895 Points
Cinebench R23 - Cinebench R23 Single Core
1844 Points (78%)
min: 1698     avg: 1870     median: 1875.5 (80%)     max: 2032 Points
Cinebench R20 - Cinebench R20 CPU (Single Core)
714 Points (79%)
min: 652     avg: 713     median: 708.5 (79%)     max: 782 Points
Cinebench R20 - Cinebench R20 CPU (Multi Core)
3046 Points (7%)
min: 2821     avg: 3378     median: 3449.5 (8%)     max: 3790 Points
Cinebench R15 - Cinebench R15 CPU Multi 64 Bit
1432 Points (9%)
min: 1040     avg: 1415     median: 1505.5 (10%)     max: 1609 Points
Cinebench R15 - Cinebench R15 CPU Single 64 Bit
257 Points (72%)
min: 243     avg: 260.3     median: 254 (71%)     max: 290 Points
7-Zip 18.03 - 7-Zip 18.03 Multi Thread 4 runs
33657 MIPS (19%)
min: 31447     avg: 36682     median: 37996.5 (22%)     max: 39286 MIPS
7-Zip 18.03 - 7-Zip 18.03 Single Thread 4 runs
5882 MIPS (69%)
min: 5407     avg: 5828     median: 5821.5 (69%)     max: 6261 MIPS
HWBOT x265 Benchmark v2.2 - HWBOT x265 4k Preset
8.7 fps (15%)
min: 8.57     avg: 9.7     median: 9.6 (17%)     max: 11.1 fps
Blender - Blender 3.3 Classroom CPU *
816 Seconds (10%)
min: 638     avg: 704     median: 674 (9%)     max: 829 Seconds
Blender - Blender 2.79 BMW27 CPU *
437 Seconds (3%)
min: 344     avg: 377.8     median: 358 (3%)     max: 451 Seconds
R Benchmark 2.5 - R Benchmark 2.5 *
0.5 sec (10%)
min: 0.4386     avg: 0.5     median: 0.4 (10%)     max: 0.502 sec
3DMark 11 - 3DM11 Performance Physics
11497 Points (29%)
min: 10433     avg: 12470     median: 12807.5 (32%)     max: 13833 Points
3DMark - 3DMark Ice Storm Physics
68313 Points (56%)
3DMark - 3DMark Cloud Gate Physics
9548 Points (24%)
min: 8566     avg: 10655     median: 10681 (27%)     max: 12693 Points
3DMark - 3DMark Fire Strike Standard Physics
15732 Points (28%)
min: 14828     avg: 16968     median: 16556 (30%)     max: 19931 Points
3DMark - 3DMark Time Spy CPU
5203 Points (22%)
min: 5039     avg: 5443     median: 5290.5 (22%)     max: 6153 Points
Geekbench 6.4 - Geekbench 6.4 Single-Core
2570 Points (64%)
min: 2253     avg: 2586     median: 2655.5 (66%)     max: 2781 Points
Geekbench 6.4 - Geekbench 6.4 Multi-Core
9733 Points (38%)
min: 7737     avg: 8993     median: 9037.5 (35%)     max: 10160 Points
Geekbench 5.5 - Geekbench 5.1 - 5.5 64 Bit Single-Core
1858 Points (73%)
min: 1631     avg: 1855     median: 1909.5 (75%)     max: 1969 Points
Geekbench 5.5 - Geekbench 5.1 - 5.5 64 Bit Multi-Core
8576 Points (15%)
min: 7178     avg: 7877     median: 7987 (14%)     max: 8354 Points
Mozilla Kraken 1.1 - Kraken 1.1 Total Score *
502 ms (1%)
min: 463     avg: 502     median: 495.5 (1%)     max: 554 ms
WebXPRT 4 - WebXPRT 4 Score
264 Points (73%)
min: 271     avg: 276     median: 276 (76%)     max: 281 Points
WebXPRT 3 - WebXPRT 3 Score
291 Points (52%)
min: 257     avg: 295     median: 306 (55%)     max: 311 Points
CrossMark - CrossMark Overall
1671 Points (62%)
min: 1660     avg: 1756     median: 1734 (65%)     max: 1874 Points
Power Consumption - Prime95 Power Consumption - external Monitor *
41.8 Watt (7%)
min: 40.6     avg: 50.7     median: 49.5 (9%)     max: 63 Watt
Power Consumption - Cinebench R15 Multi Power Consumption - external Monitor *
40.9 Watt (7%)
min: 45     avg: 59.1     median: 54.7 (10%)     max: 77.6 Watt
Power Consumption - Idle Power Consumption - external Monitor *
4.1 Watt (3%)
min: 3.66     avg: 7.9     median: 7.7 (5%)     max: 12.8 Watt
Power Consumption - Idle Power Consumption 150cd 1min *
5.1 Watt (6%)
min: 5.79     avg: 7.8     median: 6.4 (7%)     max: 11.2 Watt
Power Consumption - Power Efficiency - Cinebench R15 Multi external Monitor
35 Points per Watt (26%)
min: 20     avg: 23.3     median: 23.1 (17%)     max: 26.7 Points per Watt

Average Benchmarks Intel Core 5 120U → 100% n=25

Average Benchmarks Intel Core 7 150U → 106% n=25

- Range of benchmark values for this graphics card
red legend - Average benchmark values for this graphics card
* Smaller numbers mean a higher performance
1 This benchmark is not used for the average calculation

Add one or more devices and compare

In the following list you can select (and also search for) devices that should be added to the comparison. You can select more than one device.

restrict list:
v1.33
log 30. 17:09:08

#0 ran 0s before starting gpusingle class +0s ... 0s

#1 checking url part for id 17178 +0s ... 0s

#2 checking url part for id 17176 +0s ... 0s

#3 not redirecting to Ajax server +0s ... 0s

#4 did not recreate cache, as it is less than 5 days old! Created at Mon, 28 Apr 2025 05:16:39 +0200 +0s ... 0s

#5 composed specs +0.004s ... 0.004s

#6 did output specs +0s ... 0.004s

#7 getting avg benchmarks for device 17178 +0.004s ... 0.008s

#8 got single benchmarks 17178 +0.006s ... 0.014s

#9 getting avg benchmarks for device 17176 +0.003s ... 0.017s

#10 got single benchmarks 17176 +0.008s ... 0.024s

#11 got avg benchmarks for devices +0s ... 0.024s

#12 min, max, avg, median took s +0.024s ... 0.049s

#13 return log +0.003s ... 0.052s

Please share our article, every link counts!
Mail Logo
> Expert Reviews and News on Laptops, Smartphones and Tech Innovations > Benchmarks / Tech > Processor Comparison - Head 2 Head
Redaktion, 2017-09- 8 (Update: 2023-07- 1)