Notebookcheck Logo

Qualcomm Adreno 732 vs Qualcomm Adreno 740 vs Qualcomm Adreno 730

Qualcomm Adreno 732

► remove from comparison Qualcomm Adreno 732

The Qualcomm Adreno 732 is an integrated graphics unit that is used in the Snapdragon 7+ Gen 3 and is designed for smartphones and tablets. The associated SoC (system-on-a-chip) was introduced in March 2024 and can be found in many Android-based products in the upper mid-range and premium class.

According to rumors Qualcomm clocks the graphics chip at up to 950 MHz and uses two pipelines.

The performance is slightly above the Adreno 730 and below the 735 in our tests (as the name also suggests).

The Adreno 732 supports Vulkan 1.3, OpenGL ES 3.2, OpenCL 2.0 and DirectX 12.1. AI upscaling should make it possible to increase frame rates and improve the efficiency of some graphic effects without any major battery load.

Qualcomm Adreno 740

► remove from comparison Qualcomm Adreno 740

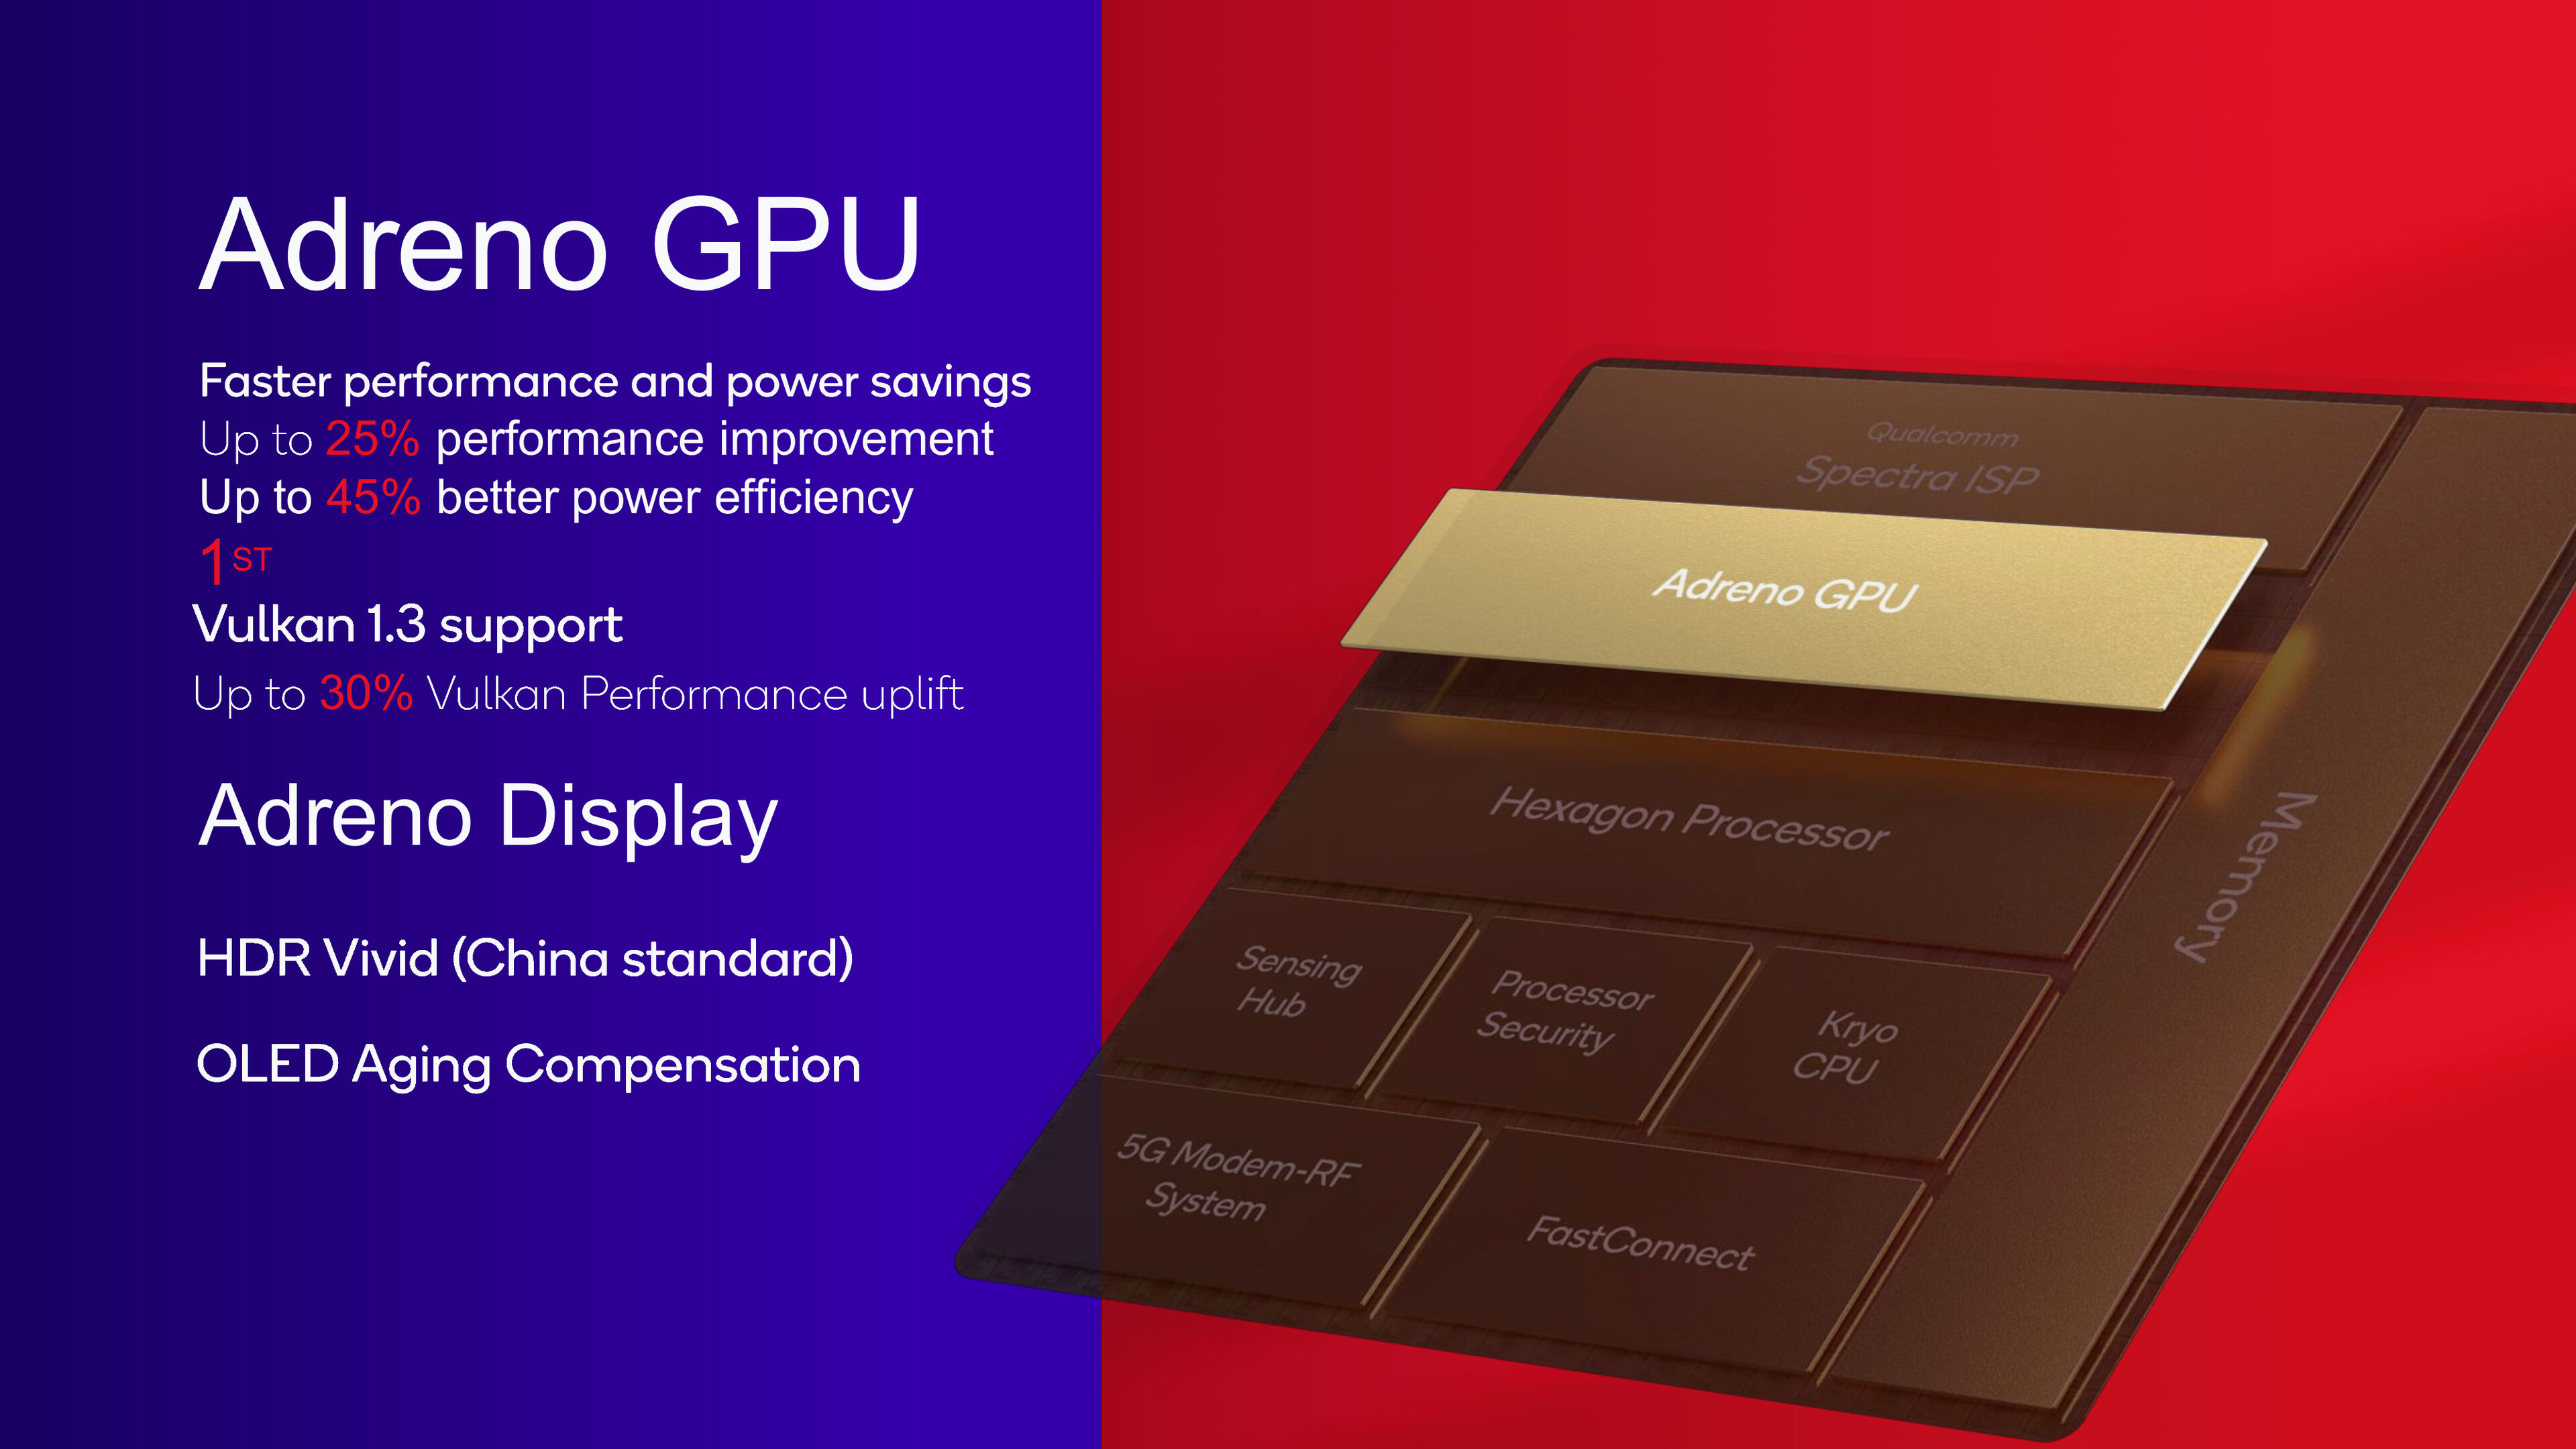
The Qualcomm Adreno 740 is a smartphone and tablet GPU that is integrated within the Qualcomm Snapdragon 8 Gen 2 SoC. The chip will be available starting early 2023 and will be used mainly in high-end Android devices. 

According to Qualcomm, the Adreno GPU offers a 25% improved performance compared to the Adreno 730 predecessor in the Snapdragon 8 Gen 1. First benchmarks show that the Adreno GPU can even beat the Apple A16 GPU (iPhone 14 Pro series) in synthetic benchmarks. Therefore, the Adreno 740 is the fastest graphics chip for smartphones in 2022.

The iGPU supports hardware accelerated ray tracing and a game post processing accelerator (for bloom, depth of field and motion blur). Another first, is the support for Vulkan 1.3.

The Snapdragon 8 Gen 2 is produced in the modern 4nm process at TSMC.

Qualcomm Adreno 730

► remove from comparison Qualcomm Adreno 730

The Qualcomm Adreno 730 is a smartphone and tablet GPU that is integrated within the Qualcomm Snapdragon 8 Gen 1 SoC. The chip will be available starting early 2022 and will be used mainly in high-end Android devices. 

According to Qualcomm, the Adreno 730 GPU offers a 30% improved performance thanks to 30% more ALUs over the Adreno 660, its predecessor, which is integrated into the Snapdragon 888 SoC.  Thanks to the new 4nm process, the power efficiency should also be improved.

The Adreno 730 supports Vulkan 1.1, OpenGL ES 3.2, and OpenCL 2.0 FP. 

Qualcomm Adreno 732Qualcomm Adreno 740Qualcomm Adreno 730
Adreno 700 Series
Adreno 750
Adreno 740
Adreno 735 @ 0.8 GHz
Adreno 732
Adreno 730 @ 0.8 GHz
Adreno 725 @ 0.8 GHz
Adreno 720 @ 0.8 GHz
Adreno 710 @ 0.8 GHz
Adreno 750
Adreno 740
Adreno 735 @ 0.8 GHz
Adreno 732
Adreno 730 @ 0.8 GHz
Adreno 725 @ 0.8 GHz
Adreno 720 @ 0.8 GHz
Adreno 710 @ 0.8 GHz
Adreno 750
Adreno 740
Adreno 735 @ 0.8 GHz
Adreno 732
Adreno 730 @ 0.8 GHz
Adreno 725 @ 0.8 GHz
Adreno 720 @ 0.8 GHz
Adreno 710 @ 0.8 GHz
Shared Memoryyesyesyes
APIDirectX 12, OpenGL ES 3.2OpenGL ES 3.2, Vulkan 1.3DirectX 12, OpenGL ES 3.2
technology4 nm4 nm4 nm
FeaturesOpenGL ES 3.2, OpenCL 2.0, DirectX 12, Vulkan 1.1OpenGL ES 3.2, OpenCL 2.0, DirectX 12, Vulkan 1.1OpenGL ES 3.2, OpenCL 2.0, DirectX 12, Vulkan 1.1
Date of Announcement23.03.2024 16.11.2022 30.11.2021
Core Speed800 (Boost) MHz
CPU in Adreno 732GPU Base SpeedGPU Boost / Turbo
Qualcomm Snapdragon 7+ Gen 38 x 1900 MHz? MHz? MHz
CPU in Adreno 740GPU Base SpeedGPU Boost / Turbo
Qualcomm Snapdragon 8 Gen 2 for Galaxy8 x 2000 MHz? MHz? MHz
Qualcomm Snapdragon 8 Gen 28 x 2000 MHz? MHz? MHz
min. - max.? MHz? MHz
CPU in Adreno 730GPU Base SpeedGPU Boost / Turbo
Qualcomm Snapdragon 8+ Gen 18 x 1800 MHz? MHz? MHz
Qualcomm Snapdragon 8 Gen 18 x 1800 MHz? MHz? MHz
min. - max.? MHz? MHz

Benchmarks

min: 1067     avg: 11770     median: 11974 (52%)     max: 15306 Points
min: 15268     avg: 24195     median: 25285 (56%)     max: 27751 Points
3DMark - 3DMark Sling Shot Extreme (ES 3.1) Unlimited
7666 Points (32%)
min: 5983     avg: 10777     median: 10726 (45%)     max: 13386 Points
3DMark - 3DMark Sling Shot Extreme (ES 3.1) Unlimited Graphics
11506 Points (29%)
min: 11082     avg: 17826     median: 18581 (46%)     max: 20955 Points
3DMark - 3DMark Wild Life Unlimited
min: 11512     avg: 11583     median: 11583 (6%)     max: 11654 Points
min: 9805     avg: 13918     median: 14012 (7%)     max: 14789 Points
min: 6483     avg: 10277     median: 10412 (5%)     max: 11201 Points
3DMark - 3DMark Wild Life Extreme Unlimited
min: 2844     avg: 2976     median: 2975.5 (3%)     max: 3107 Points
min: 3088     avg: 3641     median: 3700 (4%)     max: 3900 Points
min: 1567     avg: 2544     median: 2568 (3%)     max: 2899 Points
GFXBench - GFXBench 5.0 4K Aztec Ruins High Tier Offscreen
min: 22     avg: 22.5     median: 22.5 (8%)     max: 23 fps
min: 18     avg: 29.3     median: 30 (11%)     max: 33 fps
min: 13     avg: 19.8     median: 20 (7%)     max: 23 fps
GFXBench - GFXBench 5.0 Aztec Ruins High Tier Offscreen
min: 49     avg: 49.5     median: 49.5 (9%)     max: 50 fps
min: 24     avg: 60.8     median: 62.5 (11%)     max: 72 fps
min: 19     avg: 41.2     median: 42 (8%)     max: 52 fps
GFXBench - GFXBench 5.0 Aztec Ruins Normal Tier Offscreen
min: 130     avg: 130.5     median: 130.5 (10%)     max: 131 fps
min: 82     avg: 147.5     median: 155.5 (12%)     max: 181 fps
min: 60     avg: 104.3     median: 102 (8%)     max: 138 fps
GFXBench - GFXBench Car Chase Offscreen
min: 105     avg: 109     median: 109 (10%)     max: 113 fps
min: 67     avg: 120.2     median: 126 (12%)     max: 166 fps
min: 50     avg: 85.5     median: 84 (8%)     max: 108 fps
GFXBench 3.1 - GFXBench Manhattan ES 3.1 Offscreen
min: 191     avg: 194.5     median: 194.5 (4%)     max: 198 fps
min: 108     avg: 199.4     median: 213 (5%)     max: 226 fps
min: 95     avg: 144.2     median: 143 (3%)     max: 189 fps
GFXBench 3.0 - GFXBench 3.0 Manhattan Offscreen
min: 271     avg: 284     median: 284 (12%)     max: 297 fps
min: 115     avg: 277.5     median: 288 (12%)     max: 346 fps
min: 126     avg: 210.3     median: 211 (9%)     max: 282 fps
GFXBench (DX / GLBenchmark) 2.7
GFXBench T-Rex HD Offscreen C24Z16 + Qualcomm Adreno 732
GFXBench (DX / GLBenchmark) 2.7 - GFXBench T-Rex HD Offscreen C24Z16
min: 491     avg: 496     median: 496 (4%)     max: 501 fps
GFXBench T-Rex HD Offscreen C24Z16 + Qualcomm Adreno 740
min: 301     avg: 456.8     median: 480.5 (4%)     max: 502 fps
GFXBench T-Rex HD Offscreen C24Z16 + Qualcomm Adreno 730
min: 245     avg: 388.8     median: 389.5 (3%)     max: 468 fps
Antutu v9 - AnTuTu v9 GPU
455425 Points (46%)
min: 293017     avg: 423114     median: 430076 (43%)     max: 479126 Points
Antutu v10 - AnTuTu v10 GPU
min: 477453     avg: 485942     median: 485942 (39%)     max: 494430 Points
min: 428974     avg: 468332     median: 486753 (39%)     max: 489270 Points
Basemark GPU 1.2 - Basemark GPU 1.2 Vulkan Official Medium Offscreen 1080
min: 148.7     avg: 170.1     median: 170.1 (4%)     max: 191.5 fps
min: 208.55     avg: 211     median: 210.4 (5%)     max: 214.17 fps
min: 128.28     avg: 144.8     median: 144.8 (4%)     max: 161.33 fps
Geekbench 6.4 - Geekbench 6.4 GPU OpenCL
7837 Points (2%)
min: 5301     avg: 5752     median: 5535 (1%)     max: 6421 Points
Geekbench 6.4 - Geekbench 6.4 GPU Vulkan
9183 Points (2%)
min: 6354     avg: 7072     median: 6805.5 (2%)     max: 8322 Points
PassMark PerformanceTest Mobile V1 - PerformanceTest Mobile V1 2D Graphics Tests
43633 Points (15%)
PassMark PerformanceTest Mobile V1 - PerformanceTest Mobile V1 3D Graphics Tests
54938 Points (91%)
Power Consumption - GFXBench Aztec Ruins Normal Tier Offscreen Power Consumption 150cd *
min: 8.05     avg: 9.5     median: 9.5 (4%)     max: 11 Watt
min: 3.83     avg: 9.5     median: 9.7 (4%)     max: 14.5 Watt
min: 5.52     avg: 9.3     median: 9.4 (4%)     max: 14.2 Watt

Average Benchmarks Qualcomm Adreno 732 → 100% n=16

Average Benchmarks Qualcomm Adreno 740 → 128% n=16

Average Benchmarks Qualcomm Adreno 730 → 91% n=16

- Range of benchmark values for this graphics card
red legend - Average benchmark values for this graphics card
* Smaller numbers mean a higher performance
1 This benchmark is not used for the average calculation

Game Benchmarks

The following benchmarks stem from our benchmarks of review laptops. The performance depends on the used graphics memory, clock rate, processor, system settings, drivers, and operating systems. So the results don't have to be representative for all laptops with this GPU. For detailed information on the benchmark results, click on the fps number.

Diablo Immortal

Diablo Immortal

2022
low Medium
100%
Adreno 732:
59.9  fps
100%
Adreno 740:
60 60 60 60 60 ~ 60 fps
100%
Adreno 730:
60 60 60 60 ~ 60 fps
ultra Ultra
100%
Adreno 732:
59.7  fps
101%
Adreno 740:
60 60 60 ~ 60 fps
101%
Adreno 730:
60 60 60 60 ~ 60 fps
League of Legends: Wild Rift

League of Legends: Wild Rift

2020
low
Adreno 730:
110  fps
high
Adreno 730:
60 60 ~ 60 fps
ultra
Adreno 730:
60 60 61 ~ 60 fps
Call of Duty Mobile

Call of Duty Mobile

2020
low
Adreno 730:
55 91 ~ 73 fps
high
Adreno 730:
55  fps
ultra
Adreno 730:
55 60 ~ 58 fps
Genshin Impact

Genshin Impact

2020
low
100%
Adreno 732:
58.1  fps
102%
Adreno 740:
58.5 60.1 ~ 59 fps
88%
Adreno 730:
35 59.3 59.6 ~ 51 fps
med.
Adreno 740:
60.1  fps
Adreno 730:
35 60 ~ 48 fps
ultra
100%
Adreno 732:
40.7 60 ~ 50 fps
120%
Adreno 740:
59 59.2 59.6 60 60 60 ~ 60 fps
90%
Adreno 730:
30 34 41.7 59.4 60 ~ 45 fps
Armajet

Armajet

2020
high
Adreno 740:
59 60 60 60 60 61 63 117 119 120 ~ 78 fps
Adreno 730:
30 43 56.9 60 60 60 60 60 60 63 72 90 94 99 103 188 ~ 75 fps
PUBG Mobile

PUBG Mobile

2018
low
100%
Adreno 732:
87.1 89 ~ 88 fps
82%
Adreno 740:
60 60 60 60 60 60 60 87.5 87.8 89 90 90 ~ 72 fps
69%
Adreno 730:
57 57 58 58 58.8 59 59 59 59.8 60 60 60 60 60 60 60 60 60 89.2 ~ 61 fps
med.
Adreno 740:
60 60 60 60 ~ 60 fps
Adreno 730:
51 58 59 59 60 60 60 60 60 60 60 60 ~ 59 fps
high
100%
Adreno 732:
60  fps
100%
Adreno 740:
56.8 59 59.3 60 60 60 60 60 60 60 60 60 60 60 60 60 60 60 ~ 60 fps
95%
Adreno 730:
30 30 50 55 58 58 58.9 59 59 59 59 59.8 60 60 60 60 60 60 60 60 60 60 60 60 60 60 ~ 57 fps
ultra
100%
Adreno 732:
39.4 40 ~ 40 fps
100%
Adreno 740:
39.5 40 40 40 40 40 40 40 40 40 40 40 40 40 40 40 ~ 40 fps
100%
Adreno 730:
30 39 39 40 40 40 40 40 40 40 40 40 40 40 40 40 40 40 40 40 40 40 40 40 ~ 40 fps
World of Tanks Blitz

World of Tanks Blitz

2018
high
Adreno 740:
60  fps
Dead Trigger 2

Dead Trigger 2

2013
high
100%
Adreno 732:
117  fps
99%
Adreno 740:
116  fps
51%
Adreno 730:
60 60 ~ 60 fps
Asphalt 9: Legends

Asphalt 9: Legends

2013
low
Adreno 740:
60  fps
high
Adreno 740:
60  fps
Adreno 730:
30 60 ~ 45 fps
Subway Surfers

Subway Surfers

2012
high
Adreno 740:
120  fps

Average Gaming Qualcomm Adreno 732 → 100%

Average Gaming 30-70 fps → 100%

Average Gaming Qualcomm Adreno 740 → 100%

Average Gaming 30-70 fps → 104%

Average Gaming Qualcomm Adreno 730 → 87%

Average Gaming 30-70 fps → 87%

Qualcomm Adreno 732Qualcomm Adreno 740Qualcomm Adreno 730
lowmed.highultraQHD4Klowmed.highultraQHD4Klowmed.highultraQHD4K
Diablo Immortal59.959.760606060
Genshin Impact58.1505960.160514845
PUBG Mobile8860407260604061595740
Dead Trigger 211711660
Qualcomm Adreno 732Qualcomm Adreno 740Qualcomm Adreno 730
lowmed.highultraQHD4Klowmed.highultraQHD4Klowmed.highultraQHD4K
< 30 fps
< 60 fps
< 120 fps
≥ 120 fps

2
1


2

3


< 30 fps
< 60 fps
< 120 fps
≥ 120 fps

1
2


2


2

1
2


< 30 fps
< 60 fps
< 120 fps
≥ 120 fps

1
2

2


1
1

2
1


For more games that might be playable and a list of all games and graphics cards visit our Gaming List

v1.33
log 30. 07:39:21

#0 ran 0s before starting gpusingle class +0s ... 0s

#1 checking url part for id 12763 +0s ... 0s

#2 checking url part for id 11440 +0s ... 0s

#3 checking url part for id 11105 +0s ... 0s

#4 not redirecting to Ajax server +0s ... 0s

#5 did not recreate cache, as it is less than 5 days old! Created at Mon, 28 Apr 2025 05:17:03 +0200 +0s ... 0s

#6 composed specs +0.004s ... 0.005s

#7 did output specs +0s ... 0.005s

#8 start showIntegratedCPUs +0s ... 0.005s

#9 getting avg benchmarks for device 12763 +0.023s ... 0.027s

#10 got single benchmarks 12763 +0.004s ... 0.031s

#11 getting avg benchmarks for device 11440 +0s ... 0.032s

#12 got single benchmarks 11440 +0.029s ... 0.061s

#13 getting avg benchmarks for device 11105 +0.001s ... 0.061s

#14 got single benchmarks 11105 +0.037s ... 0.098s

#15 got avg benchmarks for devices +0s ... 0.098s

#16 No cached benchmark found, getting uncached values +0.01s ... 0.108s

#17 No cached benchmark found, getting uncached values +0.001s ... 0.109s

#18 No cached benchmark found, getting uncached values +0.003s ... 0.111s

#19 No cached benchmark found, getting uncached values +0s ... 0.112s

#20 No cached benchmark found, getting uncached values +0.003s ... 0.115s

#21 No cached benchmark found, getting uncached values +0.003s ... 0.118s

#22 min, max, avg, median took s +0.022s ... 0.14s

#23 before gaming benchmark output +0s ... 0.14s

#24 Got 259 rows for game benchmarks. +0.055s ... 0.195s

#25 composed SQL query for gamebenchmarks +0s ... 0.195s

#26 got data and put it in $dataArray +0.001s ... 0.196s

#27 benchmarks composed for output. +0.005s ... 0.201s

#28 calculated avg scores. +0s ... 0.201s

#29 return log +0.001s ... 0.202s

Please share our article, every link counts!
Mail Logo
> Expert Reviews and News on Laptops, Smartphones and Tech Innovations > Benchmarks / Tech > Graphics Card Comparison - Head 2 Head
Redaktion, 2017-09- 8 (Update: 2023-07- 1)