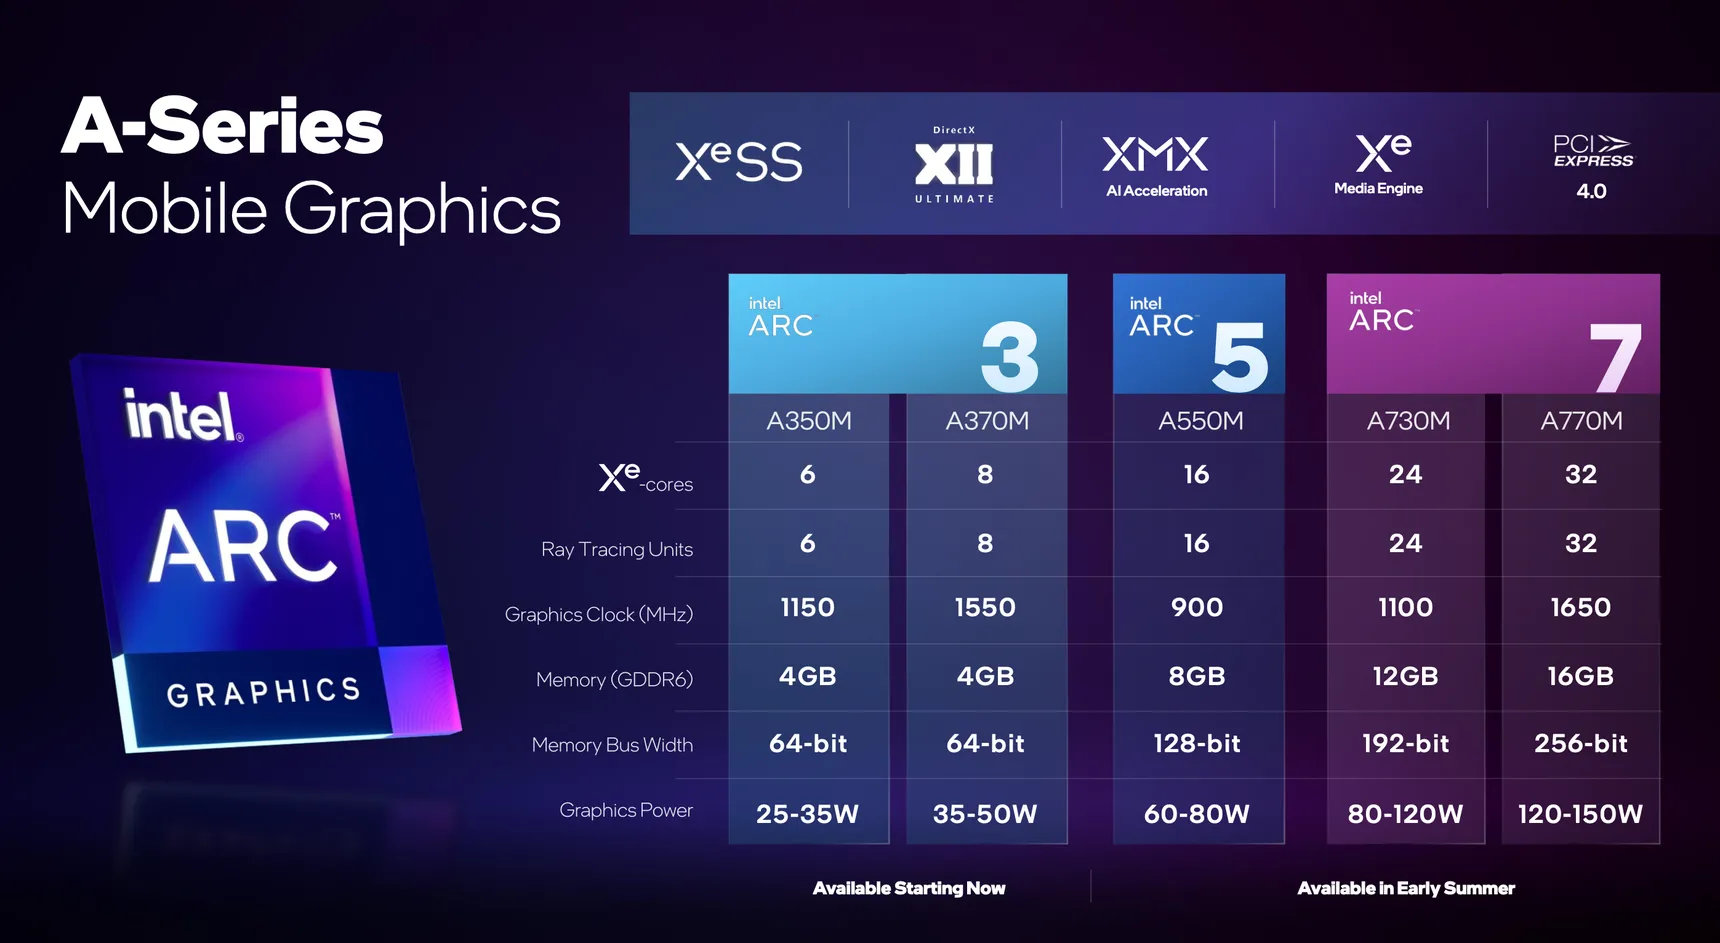
Intel Arc A730M ► remove from comparison Die Intel Arc A730M ist eine dedizierte Mittelklasse-Grafikkarte von Intel für Notebooks. Sie basiert auf den ACM-G10 Chip und bietet 24 der 32 Xe-Kerne (384 ALUs), 24 Ray-Tracing-Units, 4,6 MB L1-Cache und 16 MB L2-Cache. Das Speicherinterface ist 192 Bit breit und unterstützt 12 GB GDDR6 Grafikspeicher mit 14 Gbps. Der Chip taktet von 300 MHz bis 1100 MHz bzw. kurzzeitig bis 2050 MHz (Turbo). Der TGP ist zwischen 80 und 120 Watt je nach Modell.
Die Performance der A730M liegt in der Mittelklasse von dedizierten Grafikkarten für Notebooks. Die genauen Leistungsdaten sind noch nicht ganz klar, der Stromverbrauch spielt aber in der Klasse einer RTX 3060 und daher schätzen wir die Performance etwas darunter ein.
Der ACM-G10 Chip wird bei TSMC in 6nm gefertigt (N6 Prozess), nutzt ein BGA2660 Package, bietet 21,7 Mrd. Transistoren und ist 406 mm2 groß. Er integriert zwei Media Engines für VP9, AVC, HEVC, AV1 8k60 12-Bit HDR Dekodierung und 8k 10-Bit HDR Enkodierung. Die integrierten 4 Display Pipes unterstützen 4x 4k120 HDR, HDMI 2.0B, DP 2.0 10G und Adaptive Sync.
Mittels Deep Link kann mit einer CPU der 12. Generation (Alder Lake) Dynamic Power Share genutzt werden.
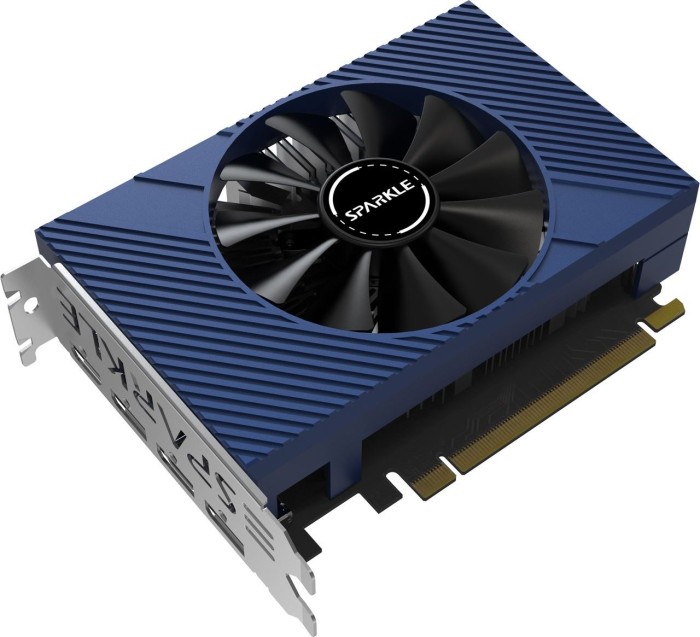
Intel Arc A310 ► remove from comparison Die Intel Arc A310 ist eine dedizierte Einstiegs-Grafikkarte von Intel für Desktops. Sie basiert auf den ACM-G11 Chip und bietet 6 der 8 Xe-Kerne (96 ALUs), 6 der 8 Ray-Tracing-Units, 1,152 MB L1-Cache und 4MB L2-Cache. Das Speicherinterface ist 64 Bit breit und unterstützt 4GB GDDR6 Grafikspeicher mit 15,5 Gbps. Der TGP ist zwischen 40 und 75 Watt je nach Modell.
Der A310 ist ähnlich zur mobilen Arc A350M , bis auf die höheren Taktraten der Kerne und des Speichers.
Der ACM-G11 Chip wird bei TSMC in 6nm gefertigt (N6 Prozess) und bietet 7,2 Mrd. Transistoren und ist 157 mm2 groß. Er integriert zwei Media Engines für VP9, AVC, HEVC, AV1 8k60 12-Bit HDR Dekodierung und 8k 10-Bit HDR Enkodierung. Die integrierten 4 Display Pipes unterstützen 4x 4k120 HDR, HDMI 2.0B, DP 2.0 10G und Adaptive Sync.
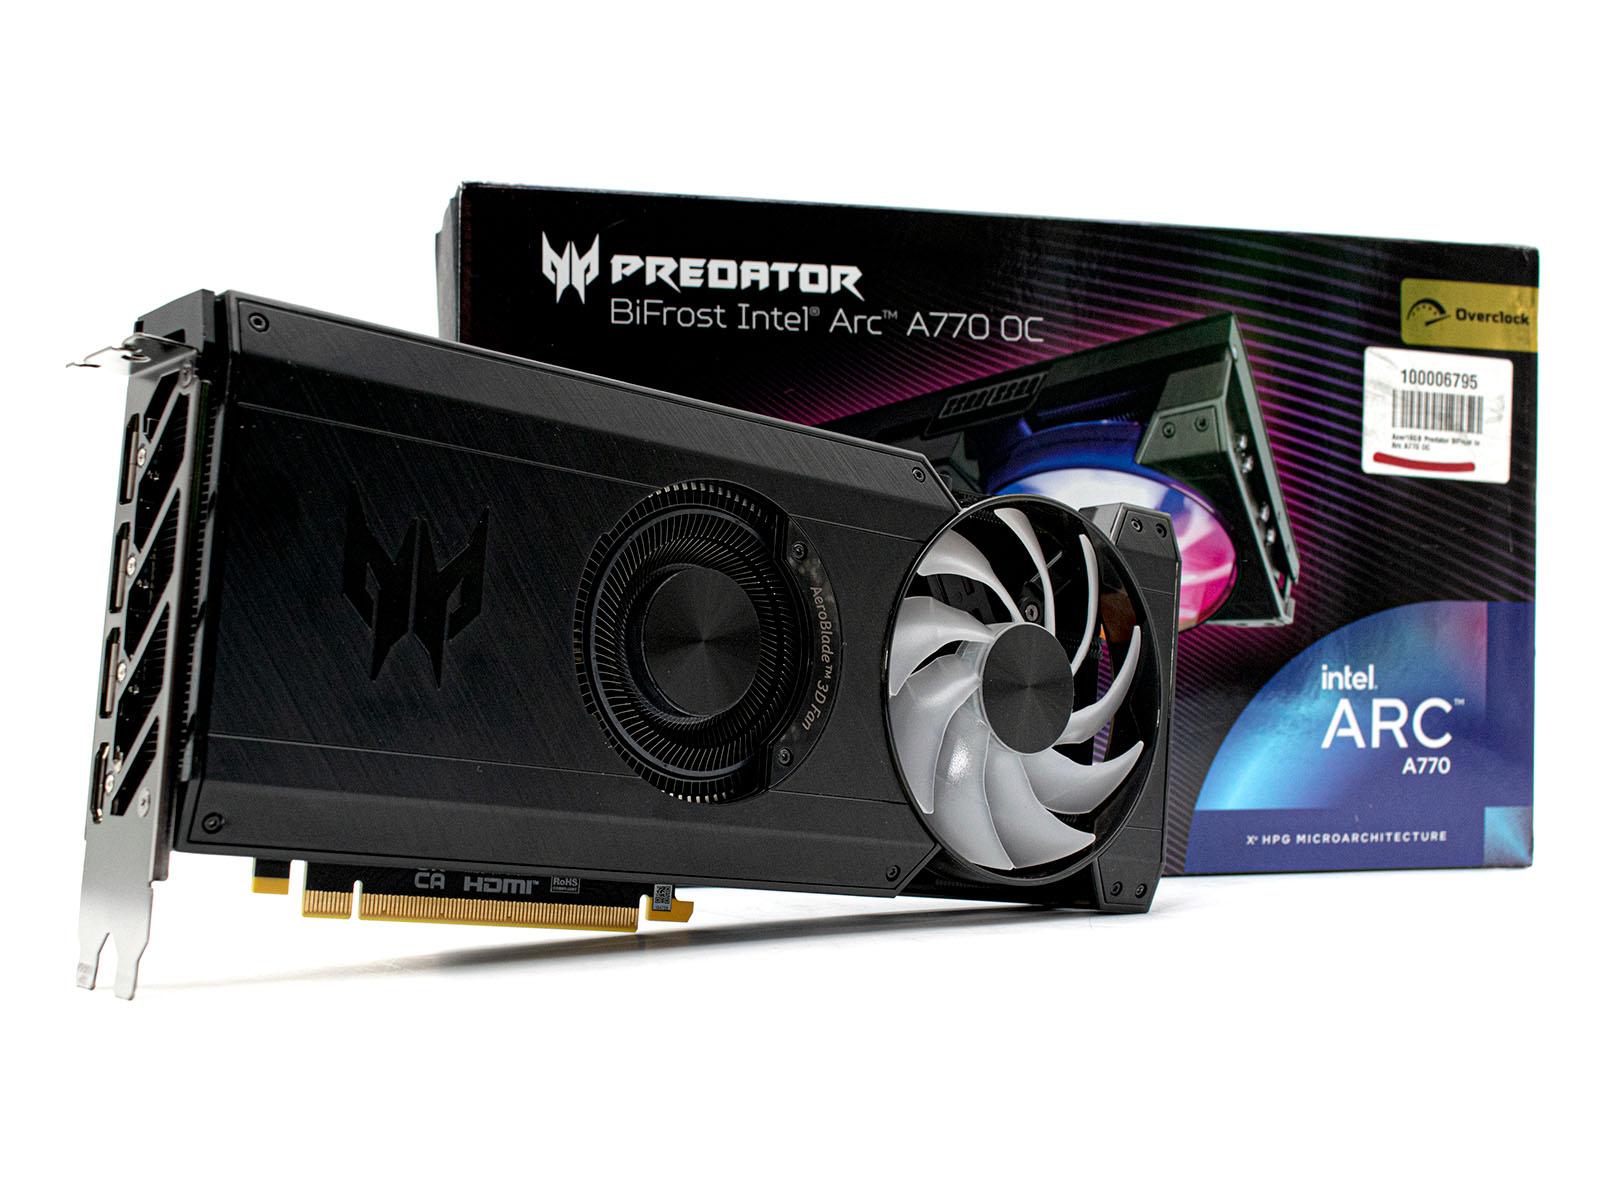
Intel Arc A770 ► remove from comparison Die Intel Arc A770 ist eine Mid-Range-Desktop-GPU und wird im 6 nm Verfahren bei TSMC gefertigt. Der Grafikprozessor verfügt über 4.096 Shadereinheiten, sowie über 8- oder 16 GB GDDR6-VRAM mit einem 256-Bit-Interface (16 Gbps, 512 GB/s).
Features
Als Topmodell auf Basis der Alchemist-Architektur bietet Intel mit der Arc A770 das Topmodell der Serie an. Als komplette Neuentwicklung will Intel mit den Grafikkarten AMD und auch Nvidia unter Druck setzen. Features wie Ray Tracing werden unterstützt und dafür bringt die Intel Arc A770 32 RT-Cores mit. Zudem implementiert Intel noch 512 Tensor Cores, welche wir auch schon bei den aktuellen Grafikkarten von Nvidia vorfinden. Mit der Unterstützung von AV1 ist die Grafikkarte vor allem für Content-Creator interessant. Das hardwareseitige Encodieren und Decodieren mit dem neuen Codec beherrschen aktuell nur die Ada Lovelace Modelle von Nvidia und die RDNA3-GPUs von AMD.
Performance
Die Leistung der Intel Arc A770 ist mit einer Nvidia GeForce RTX 4060 oder einer AMD Radeon RX 7600 vergleichbar. Mit neueren Spielen kommt das Modell aus dem Haus Intel deutlich besser zurecht. Mit aktivierten Raytracing kann sich die Intel Arc A770 sogar vor den beiden Kontrahenten platzieren. Aufgrund der gezeigten Leistung ist die Intel Arc A770 für das 1080p-Gaming im Jahre 2023 bestens geeignet.
Leistungsaufnahme
Die Leistungsaufnahme der Intel Arc A770 wird vom Hersteller mit 225 Watt (TGP) beziffert. Das ist etwas mehr als bei einer Nvidia GeForce RTX 4060 oder der AMD Radeon RX 7600 .
Intel Arc A730M Intel Arc A310 Intel Arc A770 Arc Serie Arc B580 2560 @ 2.67 - 2.67 GHz 192 Bit @ 19000 MHz Arc A770 4096 @ 2.1 - 2.4 GHz 256 Bit @ 16000 MHz Arc A750 3584 @ 2.05 - 2.4 GHz 256 Bit @ 16000 MHz Arc A580 3072 @ 1.7 - 2 GHz 256 Bit @ 16000 MHz A770M 4096 @ 1.65 GHz 256 Bit @ 16000 MHz A730M 3072 @ 1.1 GHz 192 Bit @ 14000 MHz A570M 16 @ 0.9 - 1.3 GHz 128 Bit @ 14000 MHz A550M 16 @ 0.9 - 2.01 GHz 128 Bit @ 14000 MHz A530M 12 @ 0.9 - 1.3 GHz 128 Bit @ 14000 MHz A370M 8 @ 1.55 GHz 64 Bit @ 14000 MHz Arc A380 1024 @ 2 GHz 96 Bit @ 15500 MHz A310 6 @ 2 GHz 64 Bit @ 15500 MHz A350M 6 @ 1.15 GHz 64 Bit @ 14000 MHz
Arc B580 2560 @ 2.67 - 2.67 GHz 192 Bit @ 19000 MHz Arc A770 4096 @ 2.1 - 2.4 GHz 256 Bit @ 16000 MHz Arc A750 3584 @ 2.05 - 2.4 GHz 256 Bit @ 16000 MHz Arc A580 3072 @ 1.7 - 2 GHz 256 Bit @ 16000 MHz A770M 4096 @ 1.65 GHz 256 Bit @ 16000 MHz A730M 3072 @ 1.1 GHz 192 Bit @ 14000 MHz A570M 16 @ 0.9 - 1.3 GHz 128 Bit @ 14000 MHz A550M 16 @ 0.9 - 2.01 GHz 128 Bit @ 14000 MHz A530M 12 @ 0.9 - 1.3 GHz 128 Bit @ 14000 MHz A370M 8 @ 1.55 GHz 64 Bit @ 14000 MHz Arc A380 1024 @ 2 GHz 96 Bit @ 15500 MHz A310 6 @ 2 GHz 64 Bit @ 15500 MHz A350M 6 @ 1.15 GHz 64 Bit @ 14000 MHz
Arc B580 2560 @ 2.67 - 2.67 GHz 192 Bit @ 19000 MHz Arc A770 4096 @ 2.1 - 2.4 GHz 256 Bit @ 16000 MHz Arc A750 3584 @ 2.05 - 2.4 GHz 256 Bit @ 16000 MHz Arc A580 3072 @ 1.7 - 2 GHz 256 Bit @ 16000 MHz A770M 4096 @ 1.65 GHz 256 Bit @ 16000 MHz A730M 3072 @ 1.1 GHz 192 Bit @ 14000 MHz A570M 16 @ 0.9 - 1.3 GHz 128 Bit @ 14000 MHz A550M 16 @ 0.9 - 2.01 GHz 128 Bit @ 14000 MHz A530M 12 @ 0.9 - 1.3 GHz 128 Bit @ 14000 MHz A370M 8 @ 1.55 GHz 64 Bit @ 14000 MHz Arc A380 1024 @ 2 GHz 96 Bit @ 15500 MHz A310 6 @ 2 GHz 64 Bit @ 15500 MHz A350M 6 @ 1.15 GHz 64 Bit @ 14000 MHz
Codename Alchemist Alchemist DG2-512 Architektur Xe HPG Xe HPG Xe Pipelines 3072 - unified 6 - unified 4096 - unified Raytracing Cores 24 6 32 Kerntakt 1100 MHz 2000 (Boost) MHz 2100 - 2400 (Boost) MHz Cache L1: 4.5 MB, L2: 16 MB L1: 1.1 MB, L2: 4 MB L2: 16 MB Speichertakt 14000 MHz 15500 MHz 16000 effective = 2000 MHz Speicherbandbreite 192 Bit 64 Bit 256 Bit Speichertyp GDDR6 GDDR6 GDDR6 Max. Speichergröße 12 GB 4 GB 16 GB Shared Memory nein nein nein Memory Bandwidth 336 GB/s 124 GB/s 512 GB/s API DirectX 12_2, OpenGL 4.6, Vulkan 1.3 DirectX 12_2, OpenGL 4.6, Vulkan 1.3 DirectX 12 Ultimate (12_2), Shader 6.6, OpenGL 4.6, OpenCL 3.0, Vulkan 1.3 Stromverbrauch 120 Watt (80 - 120 Watt TGP) 75 Watt (40 - 75 Watt TGP) 225 Watt Transistors 21.7 Billion 7.2 Billion 21.7 Billion Die Size 406 mm² 157 mm² 406 mm² Herstellungsprozess 6 nm 6 nm 6 nm PCIe 4 16x 4 8x 4.0 x16 Displays 4 Displays (max.), HDMI 2.0b, DisplayPort 2.0 10G Ready 4 Displays (max.), HDMI 2.0b, DisplayPort 2.0 10G Ready 4 Displays (max.), HDMI 2.1, DisplayPort 2.0 Notebookgröße mittel (15.4" z.B.) Erscheinungsdatum 30.03.2022 01.09.2022 12.10.2022 Herstellerseite ark.intel.com www.intel.com TMUs 256 ROPs 128 Tensor / AI Cores 512 Theoretical Performance 39.32 TFLOPS FP16, 19.66 TFLOPS FP32
Performance Rating - 3DMark 11 + Fire Strike + Time Spy - A730M
Performance Rating - 3DMark 11 + Fire Strike + Time Spy - A310
Performance Rating - 3DMark 11 + Fire Strike + Time Spy - Arc A770
3DMark - 3DMark Time Spy Score
min: 7653 avg: 9041 median: 8919.5 (24%) max: 10670 Points
GPU TDP ? TDP 85 W TDP 120 W 100% 78% 89%
Modell CPU GPU RAM Wert Sparkle Intel Arc A310 Elf i9-13900K A310 75 W ? / 1937 MHz 4 GB 48 GB 3743
GPU TDP ? TDP 75 W TDP 85 W TDP 120 W 100% 38% 78% 89%
min: 14047 avg: 14189 median: 14057 (37%) max: 14463 Points
GPU TDP ? TDP 75 W TDP 85 W TDP 120 W TDP 210 W 69% 26% 54% 62% 100%
3DMark - 3DMark Time Spy Graphics
min: 7212 avg: 8798 median: 8813 (18%) max: 10352 Points
GPU TDP ? TDP 85 W TDP 120 W 100% 76% 94%
Modell CPU GPU RAM Wert Sparkle Intel Arc A310 Elf i9-13900K A310 75 W ? / 1937 MHz 4 GB 48 GB 3269
GPU TDP ? TDP 75 W TDP 85 W TDP 120 W 100% 34% 76% 94%
min: 13779 avg: 13849 median: 13815 (28%) max: 13953 Points
GPU TDP ? TDP 75 W TDP 85 W TDP 120 W TDP 210 W 69% 24% 52% 65% 100%
3DMark - 3DMark Ice Storm Unlimited Graphics
min: 628292 avg: 685325 median: 699999 (71%) max: 727683 Points
GPU TDP 120 W TDP 210 W 68% 100%
3DMark - 3DMark Ice Storm Extreme Graphics
min: 442457 avg: 493853 median: 516087 (60%) max: 523016 Points
GPU TDP 120 W TDP 210 W 63% 100%
3DMark - 3DMark Cloud Gate Score
min: 42200 avg: 44782 median: 45257 (43%) max: 46415 Points
GPU TDP ? TDP 85 W TDP 120 W 98% 100% 91%
Modell CPU GPU RAM Wert Sparkle Intel Arc A310 Elf i9-13900K A310 75 W ? / 1937 MHz 4 GB 48 GB 44891
GPU TDP ? TDP 75 W TDP 85 W TDP 120 W 98% 97% 100% 91%
min: 69520 avg: 71173 median: 69692 (66%) max: 74307 Points
GPU TDP ? TDP 75 W TDP 85 W TDP 120 W TDP 210 W 64% 63% 65% 59% 100%
3DMark - 3DMark Cloud Gate Graphics
min: 75370 avg: 86896 median: 83396 (21%) max: 105420 Points
GPU TDP ? TDP 85 W TDP 120 W 72% 86% 100%
Modell CPU GPU RAM Wert Sparkle Intel Arc A310 Elf i9-13900K A310 75 W ? / 1937 MHz 4 GB 48 GB 53244
GPU TDP ? TDP 75 W TDP 85 W TDP 120 W 72% 51% 86% 100%
min: 116619 avg: 129692 median: 133291 (33%) max: 139166 Points
GPU TDP ? TDP 75 W TDP 85 W TDP 120 W TDP 210 W 59% 41% 70% 81% 100%
3DMark - 3DMark Fire Strike Standard Score
min: 16910 avg: 18480 median: 18213.5 (27%) max: 20584 Points
GPU TDP ? TDP 85 W TDP 120 W 100% 91% 86%
Modell CPU GPU RAM Wert Sparkle Intel Arc A310 Elf i9-13900K A310 75 W ? / 1937 MHz 4 GB 48 GB 8192
GPU TDP ? TDP 75 W TDP 85 W TDP 120 W 100% 42% 91% 86%
min: 26251 avg: 28447 median: 28336 (43%) max: 30755 Points
GPU TDP ? TDP 75 W TDP 85 W TDP 120 W TDP 210 W 69% 29% 63% 59% 100%
3DMark - 3DMark Fire Strike Standard Graphics
min: 19850 avg: 21265 median: 21294 (20%) max: 22620 Points
GPU TDP ? TDP 85 W TDP 120 W 94% 88% 100%
Modell CPU GPU RAM Wert Sparkle Intel Arc A310 Elf i9-13900K A310 75 W ? / 1937 MHz 4 GB 48 GB 8464
GPU TDP ? TDP 75 W TDP 85 W TDP 120 W 94% 37% 88% 100%
min: 27035 avg: 29903 median: 30008 (28%) max: 32666 Points
GPU TDP ? TDP 75 W TDP 85 W TDP 120 W TDP 210 W 71% 28% 66% 76% 100%
3DMark - 3DMark Ice Storm Graphics
min: 131746 avg: 207940 median: 134036 (15%) max: 358039 Points
GPU TDP ? TDP 120 W 37% 100%
Modell CPU GPU RAM Wert Sparkle Intel Arc A310 Elf i9-13900K A310 75 W ? / 1937 MHz 4 GB 48 GB 257130
GPU TDP ? TDP 75 W TDP 120 W 37% 72% 100%
min: 489026 avg: 564801 median: 597398 (66%) max: 607978 Points
GPU TDP ? TDP 75 W TDP 120 W TDP 210 W 24% 46% 63% 100%
3DMark - 3DMark Night Raid
min: 72422 avg: 73990 median: 72638 (69%) max: 76909 Points
3DMark - 3DMark Night Raid Graphics Score
min: 127190 avg: 129330 median: 129052 (50%) max: 131749 Points
3DMark 11 - 3DM11 Performance Score
min: 23160 avg: 24539 median: 24285.5 (29%) max: 26424 Points
GPU TDP ? TDP 85 W TDP 120 W 100% 91% 96%
Modell CPU GPU RAM Wert Sparkle Intel Arc A310 Elf i9-13900K A310 75 W ? / 1937 MHz 4 GB 48 GB 13031
GPU TDP ? TDP 75 W TDP 85 W TDP 120 W 100% 51% 91% 96%
min: 32346 avg: 35240 median: 35386 (43%) max: 37987 Points
GPU TDP ? TDP 75 W TDP 85 W TDP 120 W TDP 210 W 72% 37% 66% 69% 100%
3DMark 11 - 3DM11 Performance GPU
min: 24928 avg: 28692 median: 29144 (22%) max: 31551 Points
GPU TDP ? TDP 85 W TDP 120 W 92% 79% 100%
Modell CPU GPU RAM Wert Sparkle Intel Arc A310 Elf i9-13900K A310 75 W ? / 1937 MHz 4 GB 48 GB 11915
GPU TDP ? TDP 75 W TDP 85 W TDP 120 W 92% 38% 79% 100%
min: 34499 avg: 38352 median: 39253 (30%) max: 41303 Points
GPU TDP ? TDP 75 W TDP 85 W TDP 120 W TDP 210 W 76% 31% 65% 82% 100%
3DMark Vantage + Intel Arc A730M 3DMark Vantage - 3DM Vant. Perf. total
min: 62916 avg: 63380 median: 63380 (18%) max: 63844 Points
GPU TDP ? TDP 120 W 100% 99%
3DM Vant. Perf. total + Intel Arc A310 Modell CPU GPU RAM Wert Sparkle Intel Arc A310 Elf i9-13900K A310 75 W ? / 1937 MHz 4 GB 48 GB 46839
GPU TDP ? TDP 75 W TDP 120 W 100% 73% 99%
3DM Vant. Perf. total + Intel Arc A770 min: 103295 avg: 106563 median: 106563 (31%) max: 109831 Points
GPU TDP ? TDP 75 W TDP 120 W TDP 210 W 60% 44% 59% 100%
3DM Vant. Perf. GPU no PhysX + Intel Arc A730M 3DMark Vantage - 3DM Vant. Perf. GPU no PhysX
min: 64146 avg: 66003 median: 66003 (36%) max: 67860 Points
GPU TDP ? TDP 120 W 95% 100%
3DM Vant. Perf. GPU no PhysX + Intel Arc A310 Modell CPU GPU RAM Wert Sparkle Intel Arc A310 Elf i9-13900K A310 75 W ? / 1937 MHz 4 GB 48 GB 39213
GPU TDP ? TDP 75 W TDP 120 W 95% 58% 100%
3DM Vant. Perf. GPU no PhysX + Intel Arc A770 min: 102514 avg: 105977 median: 105976 (58%) max: 109439 Points
GPU TDP ? TDP 75 W TDP 120 W TDP 210 W 61% 37% 64% 100%
3DMark 05 - 3DMark 05 - Standard
min: 64907 avg: 68054 median: 68053.5 (75%) max: 71200 Points
GPU TDP 120 W TDP 210 W 63% 100%
3DMark 06 3DMark 06 - Standard 1280x1024 + Intel Arc A730M 3DMark 06
min: 43017 avg: 44798 median: 44798 (59%) max: 46579 Points
GPU TDP ? TDP 120 W 100% 92%
3DMark 06 - Standard 1280x1024 + Intel Arc A310 Modell CPU GPU RAM Wert 3DMark 06 - Standard 1280x1024 Sparkle Intel Arc A310 Elf (3DMark 06 - Standard 1280x1024) i9-13900K A310 75 W ? / 1937 MHz 4 GB 48 GB 53771
GPU TDP ? TDP 75 W TDP 120 W 87% 100% 80%
3DMark 06 - Standard 1280x1024 + Intel Arc A770 min: 58321 avg: 61381 median: 61380.5 (80%) max: 64440 Points
GPU TDP ? TDP 75 W TDP 120 W TDP 210 W 76% 88% 70% 100%
Unigine Valley 1.0 - Unigine Valley 1.0 DX
min: 83 avg: 91.9 median: 96.2 (29%) max: 96.5 fps
GPU TDP 120 W TDP 210 W 66% 100%
SPECviewperf 12 + Intel Arc A730M SPECviewperf 12 - specvp12 sw-03
specvp12 sw-03 + Intel Arc A770 min: 72.2 avg: 72.8 median: 72.8 (18%) max: 73.4 fps
GPU TDP 120 W TDP 210 W 81% 100%
specvp12 snx-02 + Intel Arc A730M SPECviewperf 12 - specvp12 snx-02
specvp12 snx-02 + Intel Arc A770 min: 1.42 avg: 1.5 median: 1.5 (0%) max: 1.67 fps
GPU TDP 120 W TDP 210 W 83% 100%
specvp12 showcase-01 + Intel Arc A730M SPECviewperf 12 - specvp12 showcase-01
specvp12 showcase-01 + Intel Arc A770 min: 119 avg: 130 median: 130 (23%) max: 141 fps
GPU TDP 120 W TDP 210 W 63% 100%
specvp12 mediacal-01 + Intel Arc A730M SPECviewperf 12 - specvp12 mediacal-01
specvp12 mediacal-01 + Intel Arc A770 min: 46.7 avg: 47.3 median: 47.3 (12%) max: 47.8 fps
GPU TDP 120 W TDP 210 W 75% 100%
specvp12 maya-04 + Intel Arc A730M SPECviewperf 12 - specvp12 maya-04
specvp12 maya-04 + Intel Arc A770 min: 172 avg: 177.5 median: 177.5 (48%) max: 183 fps
GPU TDP 120 W TDP 210 W 72% 100%
specvp12 energy-01 + Intel Arc A730M SPECviewperf 12 - specvp12 energy-01
specvp12 energy-01 + Intel Arc A770 min: 2.24 avg: 2.3 median: 2.3 (2%) max: 2.44 fps
GPU TDP 120 W TDP 210 W 79% 100%
specvp12 creo-01 + Intel Arc A730M SPECviewperf 12 - specvp12 creo-01
specvp12 creo-01 + Intel Arc A770 min: 45.3 avg: 45.6 median: 45.6 (18%) max: 45.8 fps
GPU TDP 120 W TDP 210 W 81% 100%
specvp12 catia-04 + Intel Arc A730M SPECviewperf 12 - specvp12 catia-04
specvp12 catia-04 + Intel Arc A770 min: 174 avg: 174.5 median: 174.5 (29%) max: 175 fps
GPU TDP 120 W TDP 210 W 74% 100%
specvp12 3dsmax-05 + Intel Arc A730M SPECviewperf 12 - specvp12 3dsmax-05
specvp12 3dsmax-05 + Intel Arc A770 min: 179 avg: 183 median: 183 (28%) max: 187 fps
GPU TDP 120 W TDP 210 W 66% 100%
SPECviewperf 13 specvp13 sw-04 + Intel Arc A730M SPECviewperf 13 - specvp13 sw-04
specvp13 sw-04 + Intel Arc A770 min: 77.5 avg: 78.4 median: 78.4 (21%) max: 79.2 fps
GPU TDP 120 W TDP 210 W 81% 100%
specvp13 snx-03 + Intel Arc A730M SPECviewperf 13 - specvp13 snx-03
specvp13 snx-03 + Intel Arc A770 min: 2.55 avg: 2.8 median: 2.8 (0%) max: 3.06 fps
GPU TDP 120 W TDP 210 W 82% 100%
specvp13 showcase-02 + Intel Arc A730M SPECviewperf 13 - specvp13 showcase-02
specvp13 showcase-02 + Intel Arc A770 min: 119 avg: 129.5 median: 129.5 (22%) max: 140 fps
GPU TDP 120 W TDP 210 W 64% 100%
specvp13 medical-02 + Intel Arc A730M SPECviewperf 13 - specvp13 medical-02
specvp13 medical-02 + Intel Arc A770 min: 80.8 avg: 88.2 median: 88.2 (15%) max: 95.6 fps
GPU TDP 120 W TDP 210 W 69% 100%
specvp13 maya-05 + Intel Arc A730M SPECviewperf 13 - specvp13 maya-05
specvp13 maya-05 + Intel Arc A770 min: 319 avg: 324 median: 324 (37%) max: 329 fps
GPU TDP 120 W TDP 210 W 71% 100%
specvp13 energy-02 + Intel Arc A730M SPECviewperf 13 - specvp13 energy-02
specvp13 energy-02 + Intel Arc A770 min: 22.3 avg: 22.4 median: 22.4 (7%) max: 22.5 fps
GPU TDP 120 W TDP 210 W 36% 100%
specvp13 creo-02 + Intel Arc A730M SPECviewperf 13 - specvp13 creo-02
specvp13 creo-02 + Intel Arc A770 min: 90 avg: 90.8 median: 90.8 (13%) max: 91.6 fps
GPU TDP 120 W TDP 210 W 80% 100%
specvp13 catia-05 + Intel Arc A730M SPECviewperf 13 - specvp13 catia-05
specvp13 catia-05 + Intel Arc A770 min: 258 avg: 259 median: 259 (29%) max: 260 fps
GPU TDP 120 W TDP 210 W 75% 100%
specvp13 3dsmax-06 + Intel Arc A730M SPECviewperf 13 - specvp13 3dsmax-06
specvp13 3dsmax-06 + Intel Arc A770 min: 179 avg: 181 median: 181 (28%) max: 183 fps
GPU TDP 120 W TDP 210 W 67% 100%
SPECviewperf 2020 specvp2020 solidworks-05 1080p + Intel Arc A730M SPECviewperf 2020 - specvp2020 solidworks-05 1080p
min: 29.92 avg: 61.5 median: 61.5 (11%) max: 93.1 fps
GPU TDP ? TDP 85 W 32% 100%
specvp2020 snx-04 1080p + Intel Arc A730M SPECviewperf 2020 - specvp2020 snx-04 1080p
min: 2.54 avg: 2.7 median: 2.7 (0%) max: 2.93 fps
GPU TDP ? TDP 85 W 100% 87%
specvp2020 snx-04 1080p + Intel Arc A770 Modell CPU GPU RAM Wert Acer Predator BiFrost Arc A770 OC i9-14900K 253 W / 253 W Arc A770 210 W 2400 / 2000 MHz 16 GB 32 GB 3.04
GPU TDP ? TDP 85 W TDP 210 W 96% 84% 100%
specvp2020 medical-03 1080p + Intel Arc A730M SPECviewperf 2020 - specvp2020 medical-03 1080p
min: 23.48 avg: 24 median: 24 (7%) max: 24.6 fps
GPU TDP ? TDP 85 W 95% 100%
specvp2020 medical-03 1080p + Intel Arc A770 Modell CPU GPU RAM Wert Acer Predator BiFrost Arc A770 OC i9-14900K 253 W / 253 W Arc A770 210 W 2400 / 2000 MHz 16 GB 32 GB 48.5
GPU TDP ? TDP 85 W TDP 210 W 48% 51% 100%
specvp2020 maya-06 1080p + Intel Arc A730M SPECviewperf 2020 - specvp2020 maya-06 1080p
min: 123.11 avg: 173.1 median: 173.1 (19%) max: 223.03 fps
GPU TDP ? TDP 85 W 55% 100%
specvp2020 maya-06 1080p + Intel Arc A770 Modell CPU GPU RAM Wert Acer Predator BiFrost Arc A770 OC i9-14900K 253 W / 253 W Arc A770 210 W 2400 / 2000 MHz 16 GB 32 GB 358
GPU TDP ? TDP 85 W TDP 210 W 34% 62% 100%
specvp2020 energy-03 1080p + Intel Arc A730M SPECviewperf 2020 - specvp2020 energy-03 1080p
min: 14.1 avg: 23 median: 23 (4%) max: 31.88 fps
GPU TDP ? TDP 85 W 100% 44%
specvp2020 energy-03 1080p + Intel Arc A770 Modell CPU GPU RAM Wert Acer Predator BiFrost Arc A770 OC i9-14900K 253 W / 253 W Arc A770 210 W 2400 / 2000 MHz 16 GB 32 GB 22.3
GPU TDP ? TDP 85 W TDP 210 W 100% 44% 70%
specvp2020 creo-03 1080p + Intel Arc A730M SPECviewperf 2020 - specvp2020 creo-03 1080p
min: 51.98 avg: 54.5 median: 54.5 (19%) max: 57 fps
GPU TDP ? TDP 85 W 91% 100%
specvp2020 creo-03 1080p + Intel Arc A770 Modell CPU GPU RAM Wert Acer Predator BiFrost Arc A770 OC i9-14900K 253 W / 253 W Arc A770 210 W 2400 / 2000 MHz 16 GB 32 GB 70.3
GPU TDP ? TDP 85 W TDP 210 W 74% 81% 100%
specvp2020 catia-06 1080p + Intel Arc A730M SPECviewperf 2020 - specvp2020 catia-06 1080p
min: 19.92 avg: 20.3 median: 20.3 (10%) max: 20.7 fps
GPU TDP ? TDP 85 W 96% 100%
specvp2020 catia-06 1080p + Intel Arc A770 Modell CPU GPU RAM Wert Acer Predator BiFrost Arc A770 OC i9-14900K 253 W / 253 W Arc A770 210 W 2400 / 2000 MHz 16 GB 32 GB 64.4
GPU TDP ? TDP 85 W TDP 210 W 31% 32% 100%
specvp2020 3dsmax-07 1080p + Intel Arc A730M SPECviewperf 2020 - specvp2020 3dsmax-07 1080p
min: 47.41 avg: 47.5 median: 47.5 (13%) max: 47.5 fps
GPU TDP ? TDP 85 W 100% 100%
specvp2020 3dsmax-07 1080p + Intel Arc A770 Modell CPU GPU RAM Wert Acer Predator BiFrost Arc A770 OC i9-14900K 253 W / 253 W Arc A770 210 W 2400 / 2000 MHz 16 GB 32 GB 96.3
GPU TDP ? TDP 85 W TDP 210 W 49% 49% 100%
specvp2020 solidworks-05 4k + Intel Arc A730M SPECviewperf 2020 - specvp2020 solidworks-05 4k
specvp2020 snx-04 4k + Intel Arc A730M SPECviewperf 2020 - specvp2020 snx-04 4k
specvp2020 snx-04 4k + Intel Arc A770 min: 2.55 avg: 2.9 median: 3 (0%) max: 3.08 fps
GPU TDP 120 W TDP 210 W 79% 100%
specvp2020 medical-03 4k + Intel Arc A730M SPECviewperf 2020 - specvp2020 medical-03 4k
specvp2020 medical-03 4k + Intel Arc A770 min: 22.3 avg: 23.1 median: 23.5 (15%) max: 23.5 fps
GPU TDP 120 W TDP 210 W 52% 100%
specvp2020 maya-06 4k + Intel Arc A730M SPECviewperf 2020 - specvp2020 maya-06 4k
specvp2020 maya-06 4k + Intel Arc A770 min: 195 avg: 196.7 median: 197 (28%) max: 198 fps
GPU TDP 120 W TDP 210 W 64% 100%
specvp2020 energy-03 4k + Intel Arc A730M SPECviewperf 2020 - specvp2020 energy-03 4k
specvp2020 energy-03 4k + Intel Arc A770 min: 25 avg: 25.2 median: 25.2 (4%) max: 25.3 fps
GPU TDP 120 W TDP 210 W 68% 100%
specvp2020 creo-03 4k + Intel Arc A730M SPECviewperf 2020 - specvp2020 creo-03 4k
specvp2020 creo-03 4k + Intel Arc A770 min: 52.9 avg: 54.3 median: 55 (25%) max: 55 fps
GPU TDP 120 W TDP 210 W 77% 100%
specvp2020 catia-06 4k + Intel Arc A730M SPECviewperf 2020 - specvp2020 catia-06 4k
specvp2020 catia-06 4k + Intel Arc A770 min: 38.9 avg: 43.3 median: 44.5 (29%) max: 46.5 fps
GPU TDP 120 W TDP 210 W 61% 100%
specvp2020 3dsmax-07 4k + Intel Arc A730M SPECviewperf 2020 - specvp2020 3dsmax-07 4k
specvp2020 3dsmax-07 4k + Intel Arc A770 min: 47.4 avg: 58.6 median: 64 (22%) max: 64.3 fps
GPU TDP 120 W TDP 210 W 44% 100%
Cinebench R10 Cinebench R10 Shading (32bit) + Intel Arc A730M Cinebench R10 - Cinebench R10 Shading (32bit)
min: 15298 avg: 16779 median: 16778.5 (12%) max: 18259 Points
GPU TDP ? TDP 120 W 84% 100%
Cinebench R11.5 Cinebench R11.5 OpenGL 64 Bit + Intel Arc A730M Cinebench R11.5 - Cinebench R11.5 OpenGL 64 Bit
min: 127.86 avg: 129 median: 129 (42%) max: 130.14 fps
GPU TDP ? TDP 120 W 100% 98%
Cinebench R15 + Intel Arc A730M Cinebench R15 - Cinebench R15 OpenGL 64 Bit
min: 196.3 avg: 197.6 median: 196.4 (11%) max: 200 fps
GPU TDP ? TDP 85 W TDP 120 W 100% 98% 98%
Cinebench R15 OpenGL Ref. Match 64 Bit + Intel Arc A730M Cinebench R15 - Cinebench R15 OpenGL Ref. Match 64 Bit
GPU TDP ? TDP 85 W TDP 120 W 100% 100% 100%
GFXBench - GFXBench 5.0 4K Aztec Ruins High Tier Offscreen
Modell CPU GPU RAM Wert Sparkle Intel Arc A310 Elf i9-13900K A310 75 W ? / 1937 MHz 4 GB 48 GB 35.9
GPU TDP ? TDP 75 W 100% 43%
GFXBench - GFXBench 5.0 Aztec Ruins High Tier Offscreen
Modell CPU GPU RAM Wert Sparkle Intel Arc A310 Elf i9-13900K A310 75 W ? / 1937 MHz 4 GB 48 GB 80.5
GPU TDP ? TDP 75 W 100% 43%
GFXBench - GFXBench 5.0 Aztec Ruins Normal Tier Offscreen
Modell CPU GPU RAM Wert Sparkle Intel Arc A310 Elf i9-13900K A310 75 W ? / 1937 MHz 4 GB 48 GB 199.7
GPU TDP ? TDP 75 W 100% 45%
Basemark GPU 1.2 - Basemark GPU 1.2 Vulkan Official Medium Offscreen 1080
min: 104.6 avg: 641 median: 640.8 (16%) max: 1177 fps
GPU TDP 120 W TDP 210 W 16% 100%
Basemark GPU 1.2 - Basemark GPU 1.2 Vulkan Official High Offscreen 2160
min: 3.64 avg: 54 median: 54 (10%) max: 104.4 fps
GPU TDP 120 W TDP 210 W 7% 100%
Geekbench 6.4 - Geekbench 6.4 GPU OpenCL
min: 74442 avg: 74865 median: 74865 (20%) max: 75288 Points
GPU TDP 85 W TDP 120 W 100% 99%
min: 108692 avg: 113475 median: 113475 (30%) max: 118258 Points
GPU TDP 85 W TDP 120 W TDP 210 W 66% 66% 100%
Geekbench 6.4 - Geekbench 6.4 GPU Vulkan
min: 74820 avg: 75687 median: 75686.5 (19%) max: 76553 Points
GPU TDP 85 W TDP 120 W 100% 98%
min: 103684 avg: 104221 median: 104220 (26%) max: 104757 Points
GPU TDP 85 W TDP 120 W TDP 210 W 73% 72% 100%
LuxMark v2.0 64Bit - LuxMark v2.0 Room GPU
Modell CPU GPU RAM Wert Sparkle Intel Arc A310 Elf i9-13900K A310 75 W ? / 1937 MHz 4 GB 48 GB 854
GPU TDP 75 W TDP 120 W 29% 100%
min: 3249 avg: 3287 median: 3287 (12%) max: 3325 Samples/s
GPU TDP 75 W TDP 120 W TDP 210 W 26% 90% 100%
LuxMark v2.0 64Bit - LuxMark v2.0 Sala GPU
Modell CPU GPU RAM Wert Sparkle Intel Arc A310 Elf i9-13900K A310 75 W ? / 1937 MHz 4 GB 48 GB 2784
GPU TDP 75 W TDP 120 W 30% 100%
min: 10015 avg: 10468 median: 10468 (18%) max: 10921 Samples/s
GPU TDP 75 W TDP 120 W TDP 210 W 27% 89% 100%
ComputeMark v2.1 - ComputeMark v2.1 Result
min: 12878 avg: 14039 median: 14038.5 (12%) max: 15199 Points
GPU TDP ? TDP 120 W 85% 100%
Modell CPU GPU RAM Wert Sparkle Intel Arc A310 Elf i9-13900K A310 75 W ? / 1937 MHz 4 GB 48 GB 5254
GPU TDP ? TDP 75 W TDP 120 W 85% 35% 100%
min: 22732 avg: 23165 median: 22765 (19%) max: 23997 Points
GPU TDP ? TDP 75 W TDP 120 W TDP 210 W 56% 23% 66% 100%
Power Consumption - Furmark Stress Test Power Consumption - external Monitor *
min: 131.6 avg: 149.8 median: 140 (19%) max: 177.9 Watt
GPU TDP ? TDP 85 W TDP 120 W 108% 107% 100%
min: 350 avg: 368 median: 368 (50%) max: 386 Watt
GPU TDP ? TDP 85 W TDP 120 W TDP 210 W 163% 161% 151% 100%
Power Consumption - The Witcher 3 Power Consumption - external Monitor *
min: 145.7 avg: 154.4 median: 149 (21%) max: 168.6 Watt
GPU TDP ? TDP 85 W TDP 120 W 104% 104% 100%
min: 287 avg: 292.5 median: 292.5 (41%) max: 298 Watt
GPU TDP ? TDP 85 W TDP 120 W TDP 210 W 135% 134% 129% 100%
Power Consumption - Witcher 3 Power Consumption *
min: 155.6 avg: 160.8 median: 160.8 (35%) max: 166 Watt
GPU TDP ? TDP 85 W 104% 100%
Power Consumption - Power Efficiency - Witcher 3 ultra
Power Consumption - Power Efficiency - Witcher 3 ultra external Monitor
GPU TDP ? TDP 210 W 100% 73%
Power Consumption - Cyberpunk 2077 Power Consumption - external Monitor *
Modell CPU GPU RAM Wert Acer Predator BiFrost Arc A770 OC i9-14900K 253 W / 253 W Arc A770 210 W 2400 / 2000 MHz 16 GB 32 GB 448
GPU TDP 120 W TDP 210 W 177% 100%
Emissions Witcher 3 Fan Noise + Intel Arc A730M Emissions - Witcher 3 Fan Noise
min: 40.5 avg: 47.1 median: 50 (71%) max: 50.65 dB(A)
GPU TDP ? TDP 85 W TDP 120 W 99% 100% 80%
Witcher 3 Fan Noise + Intel Arc A770 GPU TDP ? TDP 85 W TDP 120 W TDP 210 W 99% 100% 80% 82%
Clock Speed - GPU Clock Witcher 3 ultra
Average Benchmarks Intel Arc A730M → 100% n=15 Average Benchmarks Intel Arc A310 → 64% n=15 Average Benchmarks Intel Arc A770 → 167% n=15
- Bereich der Benchmarkergebnisse für diese Grafikkarte
- Durchschnittliche Benchmarkergebnisse für diese Grafikkarte
* Smaller numbers mean a higher performance
1 This benchmark is not used for the average calculation
Die folgenden Benchmarks basieren auf unseren Spieletests mit Testnotebooks. Die Performance dieser Grafikkarte bei den gelisteten Spielen ist abhängig von der verwendeten CPU, Speicherausstattung, Treiber und auch Betriebssystem. Dadurch müssen die untenstehenden Werte nicht repräsentativ sein. Detaillierte Informationen über das verwendete System sehen Sie nach einem Klick auf den fps-Wert.
Intel Arc A730M Intel Arc A310 Intel Arc A770 low med. high ultra QHD 4K low med. high ultra QHD 4K low med. high ultra QHD 4K F1 25 233 196.1 155.7 20.5 11.1 4.34 Doom: The Dark Ages 49.8 43.6 38.7 37.9 27 14.6 The Elder Scrolls IV Oblivion Remastered 62.9 55.2 38.2 21.8 16.2 9.46 Assassin's Creed Shadows 40 38 32 26 22 Civilization 7 347 184.6 112.1 76.6 39.7 Monster Hunter Wilds 31.2 27.3 22.2 Kingdom Come Deliverance 2 125.6 95.8 80.5 56.1 43.3 26.1 Indiana Jones and the Great Circle 68 54.5 49.4 37.9 22.2 Stalker 2 86.8 80.4 70.8 61.5 47.1 27.3 Call of Duty Black Ops 6 89 81 64 61 47 30 Until Dawn 101.6 57.1 43.1 35.9 26.2 17 God of War Ragnarök 103.9 87.5 79.9 75.1 58.8 34.6 Final Fantasy XVI 55.6 54.6 46.9 42.5 32.1 19.1 Space Marine 2 59.2 49.6 48.9 45.9 36.1 22.6 Star Wars Outlaws 48 46.8 43.1 37.6 27 14.5 Black Myth: Wukong 44 34 26 15 9 4 66 50 38 24 19 11 Once Human 95.5 63.4 56.7 52.5 34.2 14.8 96.2 95.9 88.3 80.7 53.6 27.6 The First Descendant 86 56.4 45.9 39.4 26.7 124.7 83.4 69.5 61 44.5 25 F1 24 161.9 140.3 105.5 32 21.3 282 246 187 63 43 21 Senua's Saga Hellblade 2 31.3 26 16.6 10.9 46.8 39.9 33.7 24.9 14.8 Ghost of Tsushima 57.3 50.4 44.9 37 28.7 13.6 99.5 85.6 77.5 63.9 51.3 32.5 Horizon Forbidden West 44 42.4 25.6 22.6 18.4 80.9 76.5 56.3 54.8 44.9 28.4 Alone in the Dark 108.4 95.9 90.4 57.2 30.1 188.4 162.7 145.4 83.5 52.1 22.6 Dragon's Dogma 2 52.1 47.8 39 24.7 Last Epoch 162.7 131.4 111.2 88.5 58.6 27.5 62.5 53.4 39.6 30.9 233 189.6 163.7 132.3 89.9 44.1 Skull & Bones 58 53 45 36 29 17 81 76 64 53 46 32 Helldivers 2 79.6 62.4 57.8 55.9 36.9 17.9 22.4 19.5 16.7 16.3 121.9 94.9 91.4 90.1 69.2 39.8 Enshrouded 54.9 49.8 42.5 36.1 26.2 11.8 20.4 18 13.8 9.88 74.6 67 58.2 Palworld 80.1 67.4 53.8 50.7 36.5 18.9 38.3 33.2 23.2 20.9 127.4 105.8 82 78.8 60.2 33.5 Prince of Persia The Lost Crown 347 333 316 215 116.1 260 154.7 141.6 358 358 359 351 193.2 Ready or Not 128.7 112.9 93.6 69.3 42.8 15 102.2 75.6 58.3 34.6 202 198.3 190.6 134.9 86.6 38 The Finals 144.7 109.2 97 77.4 48.9 22.7 75 53.1 46.6 34.6 204 161.7 146.2 121.5 83 40.5 Avatar Frontiers of Pandora 45 40 33 24 15 5.7 16 14 11 8.1 65 61 52 42 30 16 Call of Duty Modern Warfare 3 2023 96 86 67 29 17 106 97 79 75 57 36 EA Sports WRC 65.9 48.8 42.9 40.2 27.8 34.3 27.3 18.6 16.8 107.1 77.7 70.1 65.9 52.7 33.2 Alan Wake 2 38 35 34 11.6 6.3 16.3 13.9 12.3 56.5 55 51.6 36.1 20.1 Lords of the Fallen 46 40 34 30 3.51 22.7 22.2 18.4 14 100.4 89.8 73.1 59.4 50.4 35.1 Total War Pharaoh 234 139 84 67 53.3 27.3 111 73.6 41.6 32.3 386 244 151 119 86 46 Assassin's Creed Mirage 63 56 55 49 38 21 37 32 25 20 77 70 70 64 50 34 EA Sports FC 24 121.8 221 201 161.3 152.5 123 77 Counter-Strike 2 169 154.9 113.9 81.7 52.8 14.2 153.5 106.3 37.5 27.7 317 270 168.1 117 89.6 46.7 Cyberpunk 2077 2.2 Phantom Liberty 78 63 54 43 11.5 41 31.1 25.7 23.7 116.3 99 88.3 83.2 58.6 30.4 Baldur's Gate 3 80 60 63 56 8.91 40.6 32 25.5 24.9 130.1 109.6 94.6 90.9 63.8 33.8 Lies of P 97 96 80 71 22.9 49.3 42 36 30.3 174.5 154.5 136.8 123.6 88.8 47.5 Starfield 34 30.1 24.8 22 17.3 14.2 13 10.3 48.9 42.8 36.3 33.6 28.8 20.5 Armored Core 6 70.9 64.3 63.9 58.5 25.2 56.3 43.8 39 26.9 71.6 69.3 68 67.9 66.9 46.7 Immortals of Aveum 19.1 16.3 56.6 49 40.6 30.5 18.3 Atlas Fallen 87 80 74 42 32.6 31.8 26.7 8.12 141.4 133.9 126.3 108.9 79.4 44.3 Ratchet & Clank Rift Apart 54 48 38 36 30.3 24.6 19.1 16.1 113 98 79.2 68.5 56.4 36.2 F1 23 175 156 111 33 2.15 88 75 42 12 299 264 196.7 67.2 44.2 21.4 Diablo 4 138 124 111 86 30.4 213 193.8 177.5 157.1 112.6 61.7 Star Wars Jedi Survivor 47 43 39 36 11.6 81.1 73.1 68.4 65.1 44 22.3 Dead Island 2 147.1 120.5 93.4 74 26.1 217 187.3 149 117.8 88.2 46 The Last of Us 34.3 32.2 31.3 28.7 69.5 58.5 52.9 45.4 34.3 18.9 Resident Evil 4 Remake 94 70 64 44 9.89 42.4 30.1 21.6 9.5 165.8 119.9 111 75.2 60.7 37.1 Company of Heroes 3 102 87 62 61 15.8 35.2 31.2 25.4 24.8 182.7 155.2 125.9 123.8 94.4 59 Sons of the Forest 54 37 35 33 15.4 29.9 18.9 17.4 17.1 70.3 54.5 54.2 54 39.5 23 Atomic Heart 69 52 40 33 27.8 54.2 40.3 27.4 18.8 179.1 131.9 99.3 72.2 58.3 34.1 Returnal 59 57 52 41 15 30 29 26 21 93 90 83 72 58 37 Hogwarts Legacy 69.6 48.6 43.7 34.3 42.3 35.2 21.5 15.4 125.1 92.2 74 62.2 47 27.4 Dead Space Remake 51 49 45 44 79.2 76 69.5 67.7 48.8 26.5 The Witcher 3 v4 126.2 102.8 51.2 44.4 154.9 129.7 115.6 104.5 94.8 52.1 High On Life 147.9 110.1 80.9 64.7 268 175.3 142.5 113.7 73 33.7 The Callisto Protocol 95 78 73 51 21 168.7 128.4 120.5 85.8 68.8 44.9 Need for Speed Unbound 59.8 52.5 44.7 37.9 114.3 103.4 84.5 84.3 65.1 39.1 Spider-Man Miles Morales 60.5 58 53.4 51.4 137.3 124.4 117.4 111.5 87.2 47.2 Uncharted Legacy of Thieves Collection 31.3 35.3 27.6 26.7 63.5 61.4 59.4 57.5 47.8 29.5 A Plague Tale Requiem 67.8 58.3 43.6 33.2 12.9 97.3 83.8 66.1 51.1 39.5 23.6 The Quarry 58.9 47.5 38.1 24.8 125.4 100 80.4 61.5 43.4 22.4 F1 22 152 130 104 36 15 1.97 296 267 216 73.2 47.4 22.7 Ghostwire Tokyo 85.4 83.6 83.3 52.3 148.8 146.7 146.3 138.8 99.7 50.3 Tiny Tina's Wonderlands 133.4 96 66 53 35.5 17.2 203 162.9 114.6 94 65.8 34.1 Cyberpunk 2077 1.6 70.5 64 54 52 30.9 78 70 61.3 58.2 44.5 25.6 GRID Legends 114 103 89 71 56.9 34.7 161.1 133.7 110.5 92.6 81.7 68.4 Elden Ring 59.9 59.7 56.9 46.2 60 60 60 60 60 50 God of War 56 54 47 38 30.7 21.2 87.8 80.5 69.3 54.3 47.7 34.5 Farming Simulator 22 136.6 110.8 107.2 80.5 362 246 185.9 168.6 143.3 92.3 Forza Horizon 5 86 80 50 41 238 139 127 84 74 54 Guardians of the Galaxy 81 76 73 52 172 129 127 120 92 52 Far Cry 6 100.1 90 77 64 47 26.3 195.6 134 116.9 100.9 79.3 48.8 F1 2021 317 227 179.2 75.3 55.5 26.8 562 333 256 124.4 94 54.3 Assassin´s Creed Valhalla 64 54 48 37 116 92 79 72 60 38 Dirt 5 80.6 64.5 54 44.2 99.7 82.9 66.3 58.3 56.5 54.9 Watch Dogs Legion 85 75 48 35 102.9 101.7 93.3 73.6 58.5 36.6 Horizon Zero Dawn 135 126 115 103 84 47 Death Stranding 89.8 82.9 81.9 60 191.1 143.2 136.1 134 102 61.4 F1 2020 225 152.7 127.3 87.9 66.3 39.5 277 203 171.1 121.1 99.7 65.2 Borderlands 3 93.2 79.3 67.7 57 21.2 116.7 100.4 95.8 84.3 65.4 35.5 Control 145.7 66 51.1 212 108.5 89.4 65.1 34.9 Anno 1800 140.1 102.5 66.7 38.2 27.4 17.2 Far Cry New Dawn 98 84 81 74 39 144 120 114 103 91 56 Metro Exodus 80.5 55.6 40.6 32.1 20.5 204 149.2 103.4 84.9 70.7 46.7 Apex Legends 143.9 144 143.5 143.6 132.9 83.2 Assassin´s Creed Odyssey 78 65 56 45 40 30 Forza Horizon 4 73 33 31 23 15 8 Shadow of the Tomb Raider 101.7 69.5 67.9 60.9 27.7 269 139 129.6 115.8 86.2 48.8 Strange Brigade 405 184 153 126 54.1 187.3 79.7 65.3 53.8 666 304 258 216 157.8 89.2 Far Cry 5 117 93 86 81 35 99 51 47 44 156 117 109 104 82 49 X-Plane 11.11 52 40 34 11.3 114 102 83 67 Final Fantasy XV Benchmark 104 72 44 33.7 21.8 41.7 24.1 174 116 69 66 38 Assassin´s Creed Origins 78 66 64 57 52 38 Rise of the Tomb Raider 63.2 59.2 62 62.5 62.1 Dota 2 Reborn 108 106 95 86 60.6 155 121 112 118 83 The Witcher 3 267.3 201 110 45 176 108 56 29 460 323 196.1 71.5 59.6 73 GTA V 177.4 165 99 42 34.2 187.7 187.6 38.3 16.8 187.9 186.8 144.3 65 45 48.2 Intel Arc A730M Intel Arc A310 Intel Arc A770 low med. high ultra QHD 4K low med. high ultra QHD 4K low med. high ultra QHD 4K < 30 fps < 60 fps < 120 fps ≥ 120 fps 1 20 30 19 1 29 35 15 6 34 37 4 7 44 22 3 14 24 3 1 40 7 2 < 30 fps < 60 fps < 120 fps ≥ 120 fps 7 14 6 4 10 15 6 2 20 11 1 1 23 7 1 < 30 fps < 60 fps < 120 fps ≥ 120 fps 11 40 53 1 15 44 42 22 51 31 6 23 52 16 11 44 40 5 35 54 12 1
log 23. 07:23:13
#0 ran 0s before starting gpusingle class +0s ... 0s
#1 checking url part for id 11311 +0s ... 0s
#2 checking url part for id 12464 +0s ... 0s
#3 checking url part for id 11616 +0s ... 0s
#4 not redirecting to Ajax server +0s ... 0s
#5 did not recreate cache, as it is less than 5 days old! Created at Mon, 22 Sep 2025 05:19:37 +0200 +0s ... 0s
#6 composed specs +0.005s ... 0.005s
#7 did output specs +0s ... 0.005s
#8 start showIntegratedCPUs +0s ... 0.005s
#9 getting avg benchmarks for device 11311 +0.019s ... 0.024s
#10 got single benchmarks 11311 +0.001s ... 0.025s
#11 getting avg benchmarks for device 12464 +0.003s ... 0.028s
#12 got single benchmarks 12464 +0.004s ... 0.033s
#13 getting avg benchmarks for device 11616 +0.004s ... 0.036s
#14 got single benchmarks 11616 +0.007s ... 0.044s
#15 got avg benchmarks for devices +0s ... 0.044s
#16 min, max, avg, median took s +0.058s ... 0.101s
#17 before gaming benchmark output +0s ... 0.101s
#18 Got 1400 rows for game benchmarks. +0.054s ... 0.155s
#19 composed SQL query for gamebenchmarks +0s ... 0.155s
#20 got data and put it in $dataArray +0.009s ... 0.164s
#21 benchmarks composed for output. +0.048s ... 0.212s
#22 calculated avg scores. +0s ... 0.212s
#23 return log +0.003s ... 0.215s